21Jun

Bovespa Index Elliott Wave Analysis Shows Bullish Momentum With Wave 3 Advancing on Daily and Weekly Brazilian Market Charts

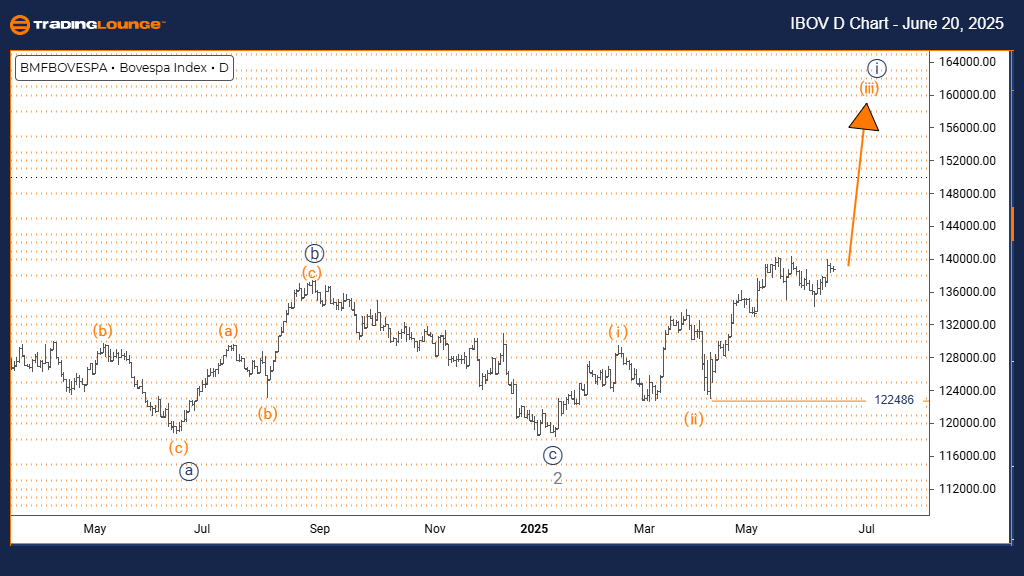
Bovespa Index Elliott Wave Analysis | Trading Lounge Day Chart

Bovespa Index Day Chart Analysis

Bovespa Index Elliott Wave Technical Analysis

FUNCTION: Bullish Trend

MODE: Impulsive

STRUCTURE: Orange wave 3

POSITION: Navy blue wave 1

DIRECTION NEXT LOWER DEGREES: Orange wave 4

DETAILS: Orange wave 2 appears complete; orange wave 3 is currently advancing.

Wave Cancel Invalidation Level: 122486

The daily Bovespa Index chart signals a bullish Elliott Wave trend in motion. Price action is unfolding impulsively, indicating firm upward market momentum. The prevailing structure is identified as orange wave 3, within the broader navy blue wave 1 phase. This setup aligns with the early stages of a prolonged bullish market cycle.

The preceding orange wave 2 correction has likely concluded, leading into a developing orange wave 3, known for strong directional pushes in Elliott Wave theory. A pullback into orange wave 4 is projected once the third wave matures.

An essential price threshold is 122486. If the index breaks below this, the current wave outlook will be invalidated and a reassessment will be required. So long as this level holds, the structure favors sustained upward price movement.

The technical chart highlights a bullish continuation driven by the unfolding orange wave 3, keeping the Bovespa Index positioned for ongoing gains.

Bovespa-Index-Day-Ch...


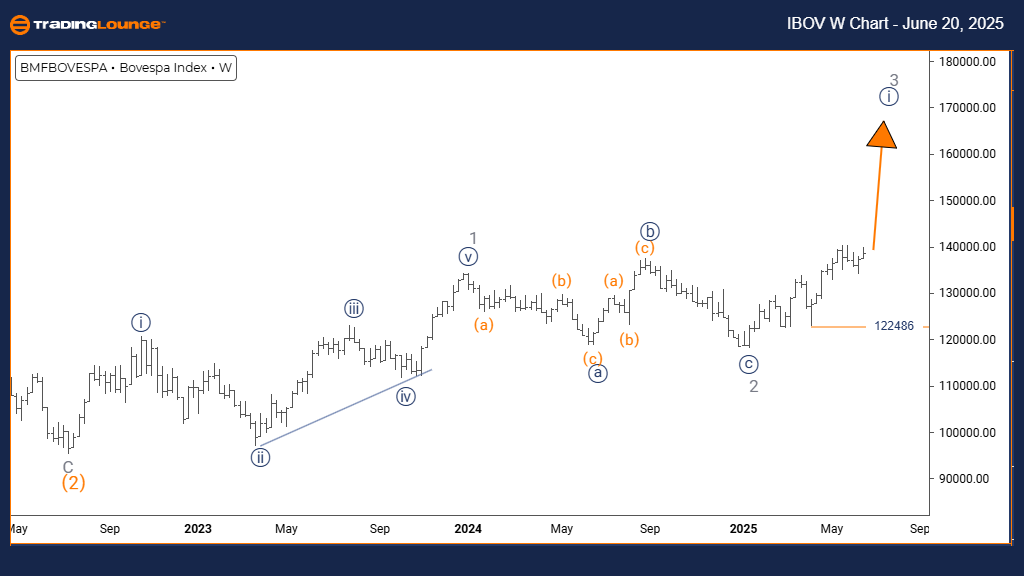
Bovespa Index Elliott Wave Analysis | Trading Lounge Weekly Chart

Bovespa Index Elliott Wave Technical Analysis

FUNCTION: Bullish Trend

MODE: Impulsive

STRUCTURE: Navy blue wave 1

POSITION: Gray wave 3

DIRECTION NEXT LOWER DEGREES: Navy blue wave 2

DETAILS: Gray wave 2 appears complete; navy blue wave 1 is now active.

Wave Cancel Invalidation Level: 122486

The weekly Bovespa Index chart supports a firm bullish Elliott Wave structure. Current momentum remains impulsive, reinforcing a strong upward bias. The chart reveals navy blue wave 1, forming part of the broader gray wave 3 sequence, pointing to a longer-term uptrend initiation.

The prior gray wave 2 correction seems finalized, clearing the way for the current navy blue wave 1 to progress. Once this wave finishes, a brief corrective move as navy blue wave 2 is expected.

A key wave invalidation point is 122486. A close beneath this would nullify the wave count and necessitate a revised interpretation. Until that occurs, the structure favors a bullish advance.

Market conditions suggest active institutional buying as navy blue wave 1 unfolds. This pattern could deliver additional price strength in the near term as part of the larger gray wave 3 rally.

Technical Analyst: Malik Awais

Source: Visit Tradinglounge.com and learn from the Experts. Join TradingLounge Here

Previous: IBEX 35 (Spain) Elliott Wave Technical Analysis

VALUE Offer - $1 for 2 Weeks then $29 a month!Click here

Access 7 Analysts Over 200 Markets Covered. Chat Room With Support

Bovespa-Index-W-Char...

Related

NEE Elliott Wave Analysis: Explore NextEra Energy Stock Trends, Flat Structures, and Bullish Reversal Forecasts

NEE Elliott Wave Analysis: Explore NextEra Energy Stock Trends, Flat Structures, and Bullish Reversal Forecasts

Elliott Wave analysis of NextEra Energy (NEE) examines current stock trends, focusing on wave C corr...

Read More >
Bearish Elliott Wave Forecast for NORTHERN STAR RESOURCES LTD – NST Targets 16.86 with No Bullish Signs

Bearish Elliott Wave Forecast for NORTHERN STAR RESOURCES LTD – NST Targets 16.86 with No Bullish Signs

Elliott Wave forecast indicates a bearish phase for Northern Star Resources (ASX:NST), targeting 16....

Read More >
Specific Price levels and Market Trends for ASX REA GROUP LTD – REA Stock Analysis & Elliott Wave Technical Forecast

Specific Price levels and Market Trends for ASX REA GROUP LTD – REA Stock Analysis & Elliott Wave Technical Forecast

This article provides a comprehensive Elliott Wave analysis of ASX: REA GROUP LTD. It includes detai...

Read More >
S&P/TSX 60 Elliott Wave Chart Reveals Bullish Impulse With Strong Wave 3 Setup and Key Support Holding at 1339

S&P/TSX 60 Elliott Wave Chart Reveals Bullish Impulse With Strong Wave 3 Setup and Key Support Holding at 1339

The S&P/TSX 60 Elliott Wave count shows a bullish structure with wave 3 developing. Canadian stocks ...

Read More >
Asian Paints Elliott Wave Technical Analysis: Share Price Forecast, Financial Overview, Earnings Reports & Market Trends

Asian Paints Elliott Wave Technical Analysis: Share Price Forecast, Financial Overview, Earnings Reports & Market Trends

Asian Paints share price movements, technical analysis, and future stock forecasts guides to cover f...

Read More >
ASX Trading Wisetech Global Limited Stock Analysis & WTC Elliott Wave Technical Forecast to Enhance your Trading Strategy

ASX Trading Wisetech Global Limited Stock Analysis & WTC Elliott Wave Technical Forecast to Enhance your Trading Strategy

Stay ahead in the market with our comprehensive Elliott Wave analysis of Wisetech Global Limited (WT...

Read More >

$1 for 2 Weeks

then $29 a month!

What a Special Offer!

Trade Recommendations

Unleash the power of deversified trading with our comprehensive portfolio, covering 250+ markets:

  • Stock Trades
  • Crypto Trades
  • Forex Trades
  • Commodity Trades
Elliott Wave Analysis

Gain a competitive edge with expert insights and AI-powered Elliott Wave charting into:

  • Global Indices
  • US Stocks & ASX Stocks
  • Forex & Crypto
  • Commodities
Top-Notch Trading Tools

Equip yourself with the tools of success:

  • Real-time Chat rooms
  • Elliott Wave Algorithm
  • Portfolio tools
  • TradingLevels
  • Screener
  • Trading Game
7 Elliott Wave Analysts

Stay ahead of the market with daily charts and insightful videos
Your secret to strategic trading!

JOIN HERE


Welcome to TradingLounge (ASIC A.R.No. 321187), specialists in trades, trading education and technical analysis, covering stocks, indices, commodities, forex and cryptocurrencies.

When you join TradingLounge you have access to everything we offer, including trade tools, educational content and a social platform to chat with like-minded investors.

Read more

@Copyright 2024 by tradinglounge.com

Contact Us

Australian no: 02 4787 6020

International no: +61 (2) 47876020

Pay with:

Find us on