Elliott Wave Analysis for NextEra Energy Inc. (NEE) - August 15, 2024
Welcome to our comprehensive Elliott Wave analysis of NextEra Energy Inc. (NEE) as of August 15, 2024. This report examines NEE's price action using Elliott Wave Theory to identify potential trading opportunities aligned with the current market trends. We provide insights by analyzing both the daily and 4-hour charts, offering a complete overview of NEE's market dynamics.
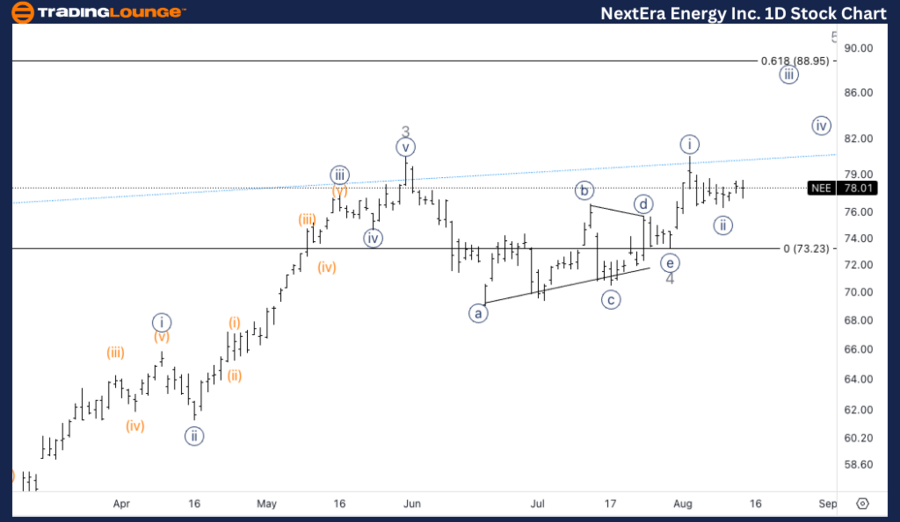
NEE Elliott Wave Analysis - Trading Lounge Daily Chart
NextEra Energy Inc. (NEE) Daily Chart Analysis
NEE Elliott Wave Technical Analysis
Function: Trend
Mode: Impulsive
Structure: Motive
Position: Wave {i} of 5
Direction: Upside in wave {iii}
Details:
The analysis indicates a possible bottoming in wave {ii}, projecting further upward movement as wave {iii} of 5 initiates. The key level to watch is the Trendline 8 (TL8) at $80. Breaking above this level would likely signal the start of wave {iii}, potentially leading to a strong rally as the wave advances.

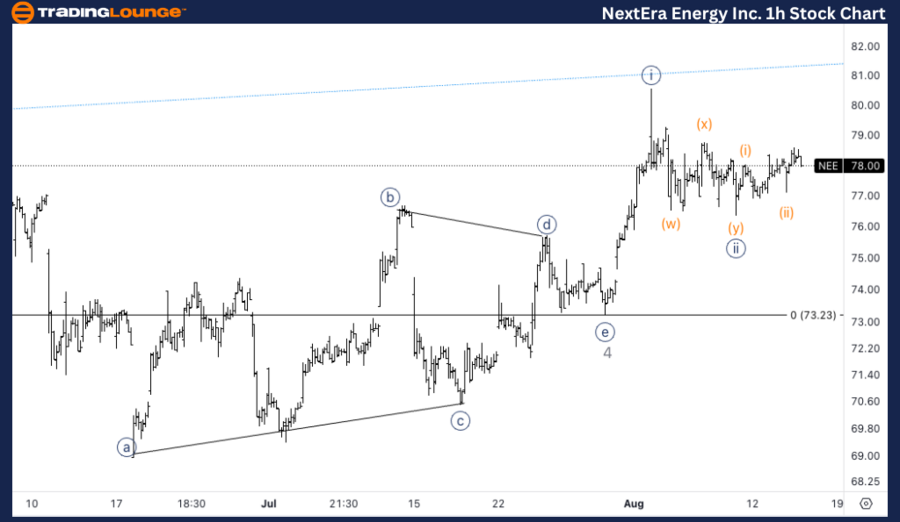
NEE Elliott Wave Analysis - Trading Lounge 4H Chart
NextEra Energy Inc. (NEE) 4H Chart Analysis
NEE Elliott Wave Technical Analysis
Function: Trend
Mode: Impulsive
Structure: Motive
Position: Wave (iii) of {iii}
Direction: Upside in (iii)
Details:
The 4-hour chart suggests a potential acceleration in wave (iii) of {iii}. If this occurs, it would confirm the progression of wave {iii}. However, there is still a chance that the price is in a corrective phase within wave {ii}, which may lead to further consolidation before the next upward movement.
Technical Analyst: Alessio Barretta
Source: visit Tradinglounge.com and learn From the Experts Join TradingLounge Here
See Previous: Caterpillar Inc. (CAT) Elliott Wave Technical Analysis
Special Trial Offer - 0.76 Cents a Day for 3 Months! Click here
Access 7 Analysts Over 170 Markets Covered. Chat Room With Support
