27Nov

HCL TECHNOLOGIES Indian Stocks Elliott Wave Technical Analysis and Stock Forecast: Learn About Price Predictions and Invalidation Points

HCL TECHNOLOGIES – HCLTECH Elliott Wave  Analysis (1D Chart)

HCL TECHNOLOGIES Day Chart Analysis

HCLTECH Elliott Wave Technical Analysis

Function: Larger Degree Trend Higher (Intermediate degree, orange)

Mode: Motive

Structure: Impulse

Position: Minute Wave ((v)) Navy

Details: Minute Wave ((v)) is progressing higher within Minor Wave 5 of Intermediate Wave (5) Orange, targeting levels above 1750.

Invalidation Point: 1750

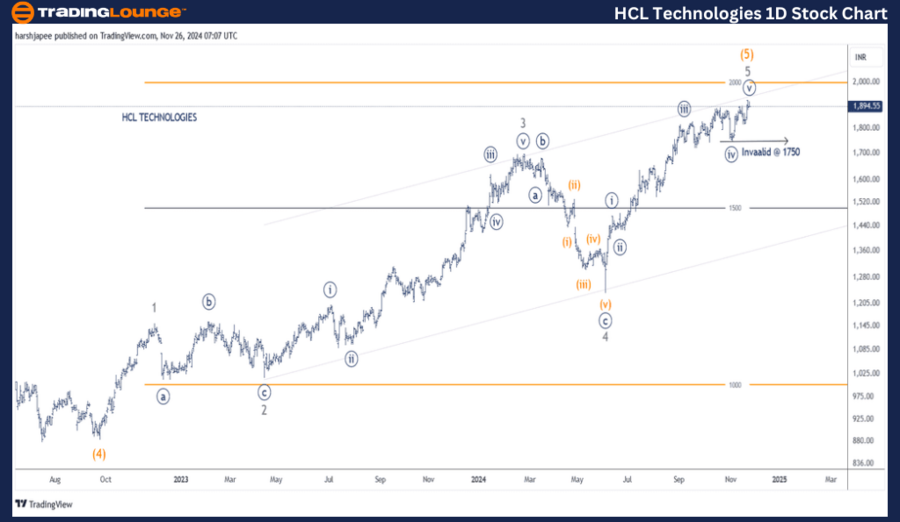
HCL TECHNOLOGIES Daily Chart Technical Analysis and Potential Elliott Wave Counts

The daily chart for HCL Technologies suggests the larger-degree uptrend could be nearing its completion, currently at the 1930 mark. Intermediate Wave (5) Orange appears either complete or approaching completion. A break below 1750 would indicate a possible trend reversal.

  • Earlier, the stock dropped to 885 lows during Intermediate Wave (4) in September 2022, mirroring the bottoming patterns seen across global tech stocks during that period.
  • Since that low, a clear five-wave rally has formed, with the stock peaking at 1930.
  • Minor Wave 3 showed an extension, while Minor Wave 4 unfolded as a Flat (3-3-5) pattern.

If the current structure remains valid, a downward movement could be on the horizon. The 1750 level for Minute Wave ((iv)) is critical for bulls to maintain control.


HCL-TECHNOLOGIES-1D-...


HCL TECHNOLOGIES – HCLTECH (4H Chart) Elliott Wave Technical Analysis

Function: Larger Degree Trend Higher (Intermediate degree, orange)

Mode: Motive

Structure: Impulse

Position: Minute Wave ((v)) Navy

Details: Minute Wave ((v)) continues to rise within Minor Wave 5 of Intermediate Wave (5) Orange.

Invalidation Point: 1750

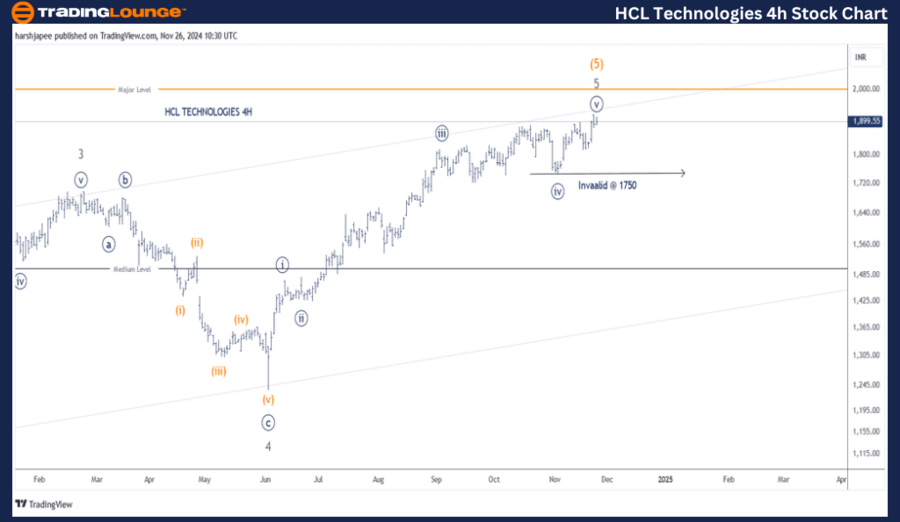
HCL TECHNOLOGIES 4H Chart Technical Analysis and Potential Elliott Wave Counts

The 4-hour chart for HCL Technologies offers a detailed view of the subwaves following the completion of Minor Wave 3, which peaked around 1695 in February 2024. Minor Wave 4 subsequently unfolded as a Flat (3-3-5) structure, ending near the 1240 level.

  • Minor Wave 5 has since taken shape as an impulse, driving the price to break past 1930, with Minute Wave ((v)) still progressing.

Technical Analyst: Harsh Japee

Source: visit Tradinglounge.com and learn From the Experts Join TradingLounge Here 

Previous: AXIS BANK LTD – AXISBANK Elliott Wave Technical Analysis

VALUE Offer - Buy 1 Month & Get 3 Months!Click here

Access 7 Analysts Over 200 Markets Covered. Chat Room With Support

HCL-TECHNOLOGIES-4h-...


Conclusion:

HCL Technologies is advancing higher within Minute Wave ((v)) of Minor Wave 5, maintaining bullish momentum as long as the price stays above the 1750 invalidation level.

Related

Explore our detailed U.S.Dollar/Japanese Yen(USDJPY) Forex Elliott Wave Technical Analysis

Explore our detailed U.S.Dollar/Japanese Yen(USDJPY) Forex Elliott Wave Technical Analysis

Explore our detailed USD/JPY Elliott Wave analysis, focusing on daily and 4-hour charts. Understand ...

Read More >
CSX Corp. (CSX) U.S. Stocks Elliott Wave Technical Analysis: Shows Bullish Trend, Predicting Price Surge Toward Resistance Level

CSX Corp. (CSX) U.S. Stocks Elliott Wave Technical Analysis: Shows Bullish Trend, Predicting Price Surge Toward Resistance Level

Detailed Elliott Wave analysis for CSX Corp. shows bullish momentum in wave {v} of 3, projecting pot...

Read More >
Key Spain Market Insights, Bullish Trends and The Best Stocks to Watch: IBEX 35 Index Elliott Wave Technical Analysis

Key Spain Market Insights, Bullish Trends and The Best Stocks to Watch: IBEX 35 Index Elliott Wave Technical Analysis

The IBEX 35 market analysis reveals a bullish Elliott Wave trend, highlighting key IBEX 35 trading s...

Read More >
Insurance Australia Group (ASX:IAG) Elliott Wave Forecast: Chart Analysis, Price Targets, Resistance Levels & Trading Strategy

Insurance Australia Group (ASX:IAG) Elliott Wave Forecast: Chart Analysis, Price Targets, Resistance Levels & Trading Strategy

ASX: IAG shows signs of completing wave B-grey in an Expanded Flat. Expect resistance before a possi...

Read More >
Bitcoin/U.S. dollar(BTCUSD) Elliott Wave Technical Analysis 13 October 23

Bitcoin/U.S. dollar(BTCUSD) Elliott Wave Technical Analysis 13 October 23

Elliott Wave Technical Analysis of Bitcoin/U.S. dollar(BTCUSD) 13 October 23

Read More >
BTC Price Prediction & Crypto Market News Today: Bitcoin Elliott Wave Technical Analysis, Key Support and Expert Trading Strategies

BTC Price Prediction & Crypto Market News Today: Bitcoin Elliott Wave Technical Analysis, Key Support and Expert Trading Strategies

This article provides a detailed BTCUSD Elliott Wave analysis, outlining Bitcoin’s current price ac...

Read More >

$1 for 2 Weeks

then $29 a month!

What a Special Offer!

Trade Recommendations

Unleash the power of deversified trading with our comprehensive portfolio, covering 250+ markets:

  • Stock Trades
  • Crypto Trades
  • Forex Trades
  • Commodity Trades
Elliott Wave Analysis

Gain a competitive edge with expert insights and AI-powered Elliott Wave charting into:

  • Global Indices
  • US Stocks & ASX Stocks
  • Forex & Crypto
  • Commodities
Top-Notch Trading Tools

Equip yourself with the tools of success:

  • Real-time Chat rooms
  • Elliott Wave Algorithm
  • Portfolio tools
  • TradingLevels
  • Screener
  • Trading Game
7 Elliott Wave Analysts

Stay ahead of the market with daily charts and insightful videos
Your secret to strategic trading!

JOIN HERE


Welcome to TradingLounge (ASIC A.R.No. 321187), specialists in trades, trading education and technical analysis, covering stocks, indices, commodities, forex and cryptocurrencies.

When you join TradingLounge you have access to everything we offer, including trade tools, educational content and a social platform to chat with like-minded investors.

Read more

@Copyright 2024 by tradinglounge.com

Contact Us

Australian no: 02 4787 6020

International no: +61 (2) 47876020

Pay with:

Find us on