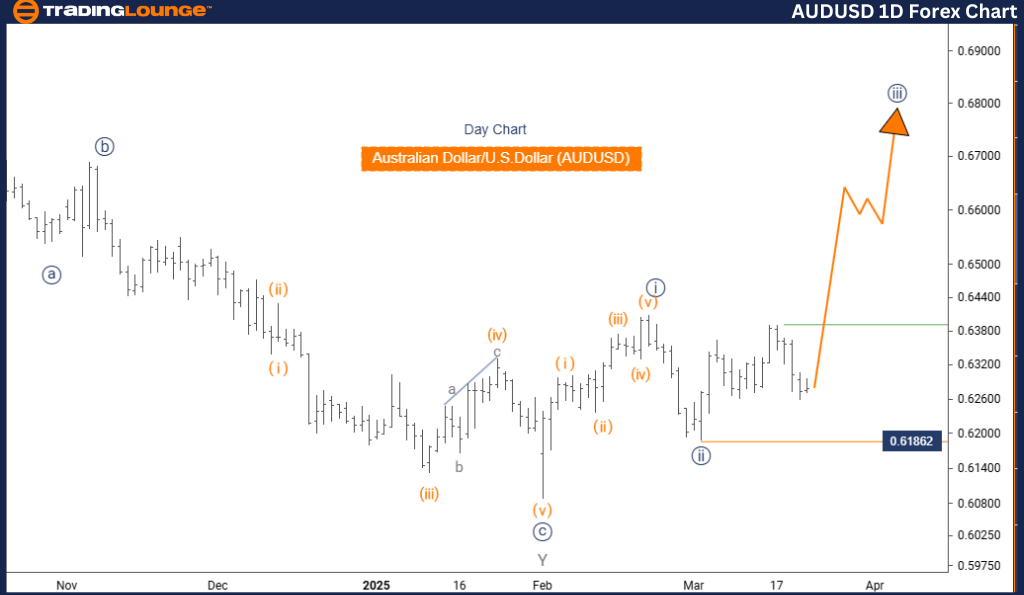
Australian Dollar/U.S. Dollar (AUDUSD) Elliott Wave Analysis – TradingLounge Day Chart
AUDUSD Elliott Wave Technical Analysis
FUNCTION: Trend
MODE: Impulsive
STRUCTURE: Navy Blue Wave 3
POSITION: Gray Wave 1
DIRECTION NEXT HIGHER DEGREES: Navy Blue Wave 3 (Initiated)
DETAILS: Completion of Navy Blue Wave 2 confirmed; Navy Blue Wave 3 now in progress.
Cancel Invalid Level: 0.61862
The daily Elliott Wave forecast for AUDUSD highlights its trending momentum, indicating a strong impulsive pattern over corrective moves. Market activity points toward a continuation of upward price action.
The primary focus lies on Navy Blue Wave 3, which is unfolding within Gray Wave 1, signifying its place in a broader Elliott Wave hierarchy. Analysis supports that Navy Blue Wave 2 has finalized, clearing the path for the initiation of Navy Blue Wave 3.
This phase is expected to maintain bullish pressure until the next significant market shift. The higher-degree wave to track is also Navy Blue Wave 3, which is already underway. A critical invalidation marker is at 0.61862. Breaching this price level may nullify the current wave setup and signal a trend reversal.
Traders are advised to monitor Navy Blue Wave 3 for sustained bullish developments. Recognizing wave sequences is crucial for navigating market behavior and planning trades effectively.
This daily chart analysis gives traders a strategic edge by putting emphasis on long-term trend analysis and critical turning points. Understanding these wave patterns and invalidation levels equips traders to make informed decisions as new waves emerge. This wave-based framework strengthens strategy and preparedness in dynamic forex conditions.
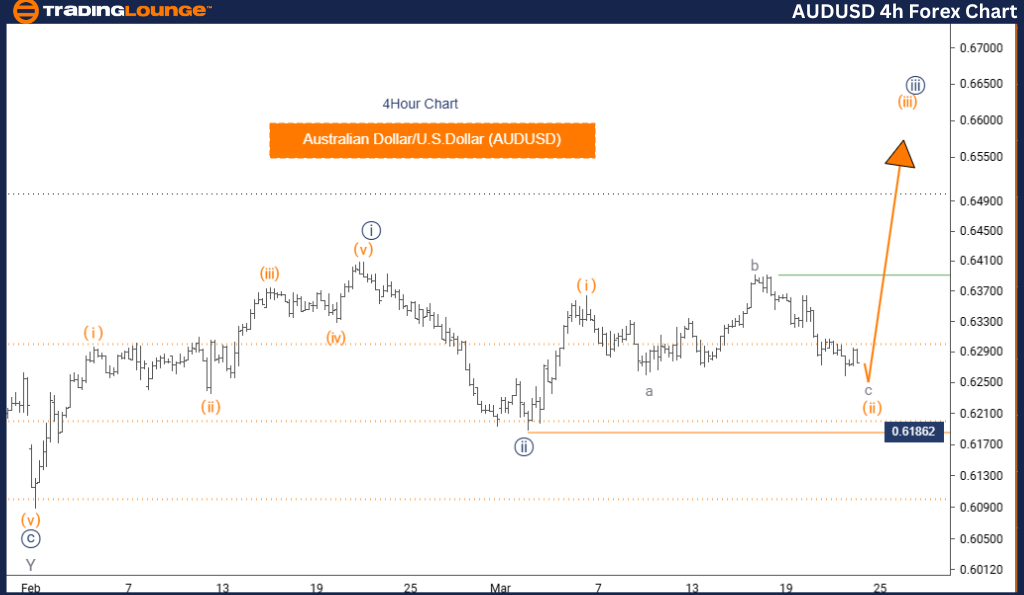
Australian Dollar/U.S. Dollar (AUDUSD) Elliott Wave Analysis – TradingLounge 4 Hour Chart
AUDUSD Elliott Wave Technical Analysis
FUNCTION: Counter Trend
MODE: Corrective
STRUCTURE: Orange Wave 2
POSITION: Navy Blue Wave 3
DIRECTION NEXT HIGHER DEGREES: Orange Wave 3
DETAILS: Orange Wave 1 has concluded; Orange Wave 2 is forming.
Cancel Invalid Level: 0.61862
The Elliott Wave analysis of the AUDUSD 4-hour chart reviews the short-term market setup, currently indicating a corrective phase. The price action reflects a pullback mode rather than a strong directional move.
The structure under observation is Orange Wave 2, forming within the context of Navy Blue Wave 3. This confirms the sub-wave’s contribution to a broader bullish pattern. The data suggest Orange Wave 1 has ended, and Orange Wave 2 is currently shaping the market.
As a corrective wave, Orange Wave 2 could involve sideways movement or temporary declines before transitioning into Orange Wave 3. Traders should note that 0.61862 is the key invalidation level; a breakout beyond this could dismiss the current wave count and imply trend reconfiguration.
Market participants should monitor Orange Wave 2 closely for signs of conclusion and prepare for a potential bullish transition into Orange Wave 3. Identifying the phase change within this cycle is essential for accurate trade timing.
This 4-hour AUDUSD analysis sharpens focus on short-term forex trading strategies by highlighting wave structures and critical price levels. By using Elliott Wave patterns, traders gain valuable insight into the market's direction and timing, allowing for more precise decisions in fast-changing environments.
Technical Analyst: Malik Awais
Source: Visit Tradinglounge.com and learn from the Experts Join TradingLounge Here
Previous: GBPUSD Elliott Wave Technical Analysis
VALUE Offer - Buy 1 Month & Get 3 Months!Click here
Access 7 Analysts Over 200 Markets Covered. Chat Room With Support