21Mar

GBPUSD Elliott Wave Analysis: Daily and 4-Hour Forecast, Key Wave Counts, and Bullish Market Structure Insights

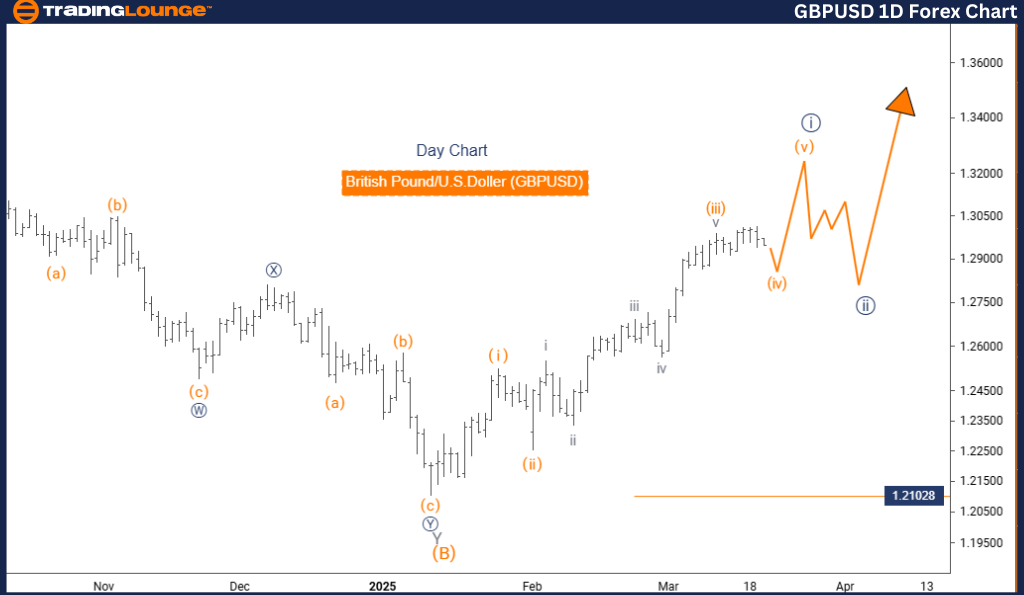
British Pound / U.S. Dollar (GBPUSD) Elliott Wave Analysis – TradingLounge Day Chart

GBPUSD Elliott Wave Technical Analysis

Function: Bullish Trend

Mode: Impulsive

Structure: Navy Blue Wave 1

Position: Gray Wave 1

Next Lower Degree Direction: Navy Blue Wave 2

Wave Invalidation Level: 1.21028

Analysis Overview:

The daily Elliott Wave analysis for GBPUSD highlights a bullish market structure with strong upward momentum. The current impulsive movement forms part of Navy Blue Wave 1, nested within the broader Gray Wave 1, confirming the ongoing bullish sentiment for GBPUSD.

Traders should recognize that Navy Blue Wave 1 is currently active and gaining strength. This phase is likely to continue until a transition into Navy Blue Wave 2 begins. A vital support level to monitor is 1.21028—any drop below this level would invalidate the existing wave count and may suggest a shift in the prevailing trend.

Trading Outlook:

  • Monitor the development of Navy Blue Wave 1 for trend continuation.
  • Watch for early signs of transition to Navy Blue Wave 2.
  • A move below 1.21028 signals a possible wave count reassessment.

Identifying wave positions and invalidation points is crucial for staying aligned with the GBPUSD price direction. By observing Elliott Wave structures on the daily chart, forex traders can gain insights into long-term bullish trends and potential correction zones. These technical levels provide strategic guidance for GBPUSD price forecasting and risk management.

GBPUSD-1d-forex-char...


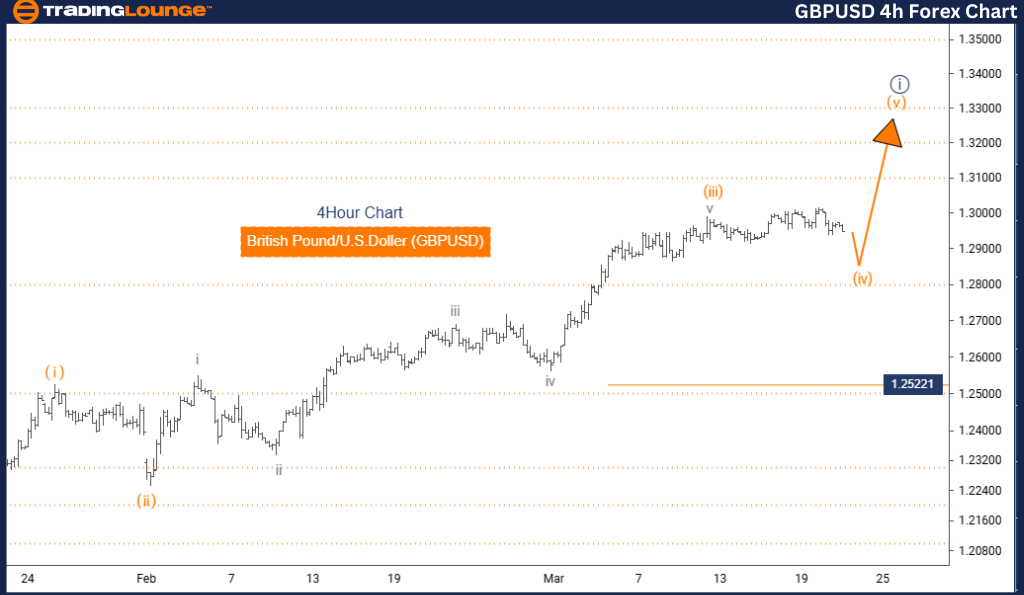
British Pound / U.S. Dollar (GBPUSD) Elliott Wave Analysis – TradingLounge 4-Hour 

GBPUSD Elliott Wave Technical Analysis

Function: Counter Trend

Mode: Corrective

Structure: Orange Wave 4

Position: Navy Blue Wave 1

Next Lower Degree Direction: Orange Wave 5

Wave Invalidation Level: 1.25221

Analysis Overview:

This 4-hour GBPUSD Elliott Wave chart highlights a corrective market phase. Currently, Orange Wave 4 is in progress within the larger Navy Blue Wave 1, signaling a temporary pullback rather than sustained bullish movement.

Orange Wave 3 has concluded, and the development of Orange Wave 4 of 3 is underway. As a corrective wave, this phase is expected to show sideways or consolidating behavior. Following its completion, Orange Wave 5 will likely resume the broader impulsive move upward.

The key resistance level to watch is 1.25221. If GBPUSD breaks above this point, it will invalidate the current wave count, requiring a revised outlook.

Trading Outlook:

  • Focus on price action during Orange Wave 4 to identify potential entries.
  • Prepare for the next leg of the trend with Orange Wave 5.
  • Maintain caution if price approaches or exceeds 1.25221.

Using the 4-hour chart for short-term GBPUSD wave analysis helps traders adapt to immediate price fluctuations and refine their strategy. Recognizing the end of corrective waves and preparing for impulsive continuations enables better execution and risk control in dynamic forex markets.

Technical Analyst: Malik Awais

Source: Visit Tradinglounge.com and learn from the Experts Join TradingLounge Here 

Previous: EURUSD Elliott Wave Technical Analysis

VALUE Offer - Buy 1 Month & Get 3 Months!Click here

Access 7 Analysts Over 200 Markets Covered. Chat Room With Support

GBPUSD-4h-forex-char...

Related

 S&P BSE Sensex Index Elliott Wave Analysis Shows Strong Bullish Trend on Daily and Weekly Charts for Indian Stock Market Forecast

S&P BSE Sensex Index Elliott Wave Analysis Shows Strong Bullish Trend on Daily and Weekly Charts for Indian Stock Market Forecast

S&P BSE Sensex highlights strong bullish momentum across both daily and weekly charts. Covering navy...

Read More >
Russell 2000 Trading Insights with Elliott Wave Technical Analysis: Explore RUT Market Updates, Investment Tips

Russell 2000 Trading Insights with Elliott Wave Technical Analysis: Explore RUT Market Updates, Investment Tips

This article dives into Russell 2000 trading with an in-depth Elliott Wave analysis. Explore RUT mar...

Read More >
Coffee Commodity Elliott Wave Technical Analysis: Focusing on the Current Market Trends and Future Predictions

Coffee Commodity Elliott Wave Technical Analysis: Focusing on the Current Market Trends and Future Predictions

This article provides a detailed Elliott Wave Analysis of coffee prices, focusing on the current mar...

Read More >
BTCUSD Elliott Wave Analysis: Master Bitcoin Price Trends, Trading Strategies, Corrective Waves, and Technical Indicators

BTCUSD Elliott Wave Analysis: Master Bitcoin Price Trends, Trading Strategies, Corrective Waves, and Technical Indicators

This article provides a thorough BTCUSD Elliott Wave analysis for Bitcoin, covering price trends, co...

Read More >
Learn the key aspects of NAB Stock Analysis & Elliott Wave Technical Forecast: NATIONAL AUSTRALIA BANK LIMITED

Learn the key aspects of NAB Stock Analysis & Elliott Wave Technical Forecast: NATIONAL AUSTRALIA BANK LIMITED

Stay ahead with our comprehensive analysis of National Australia Bank (NAB) stocks using Elliott Wav...

Read More >
Alphabet Inc.(GOOGL:NASDAQ) Elliott Wave Technical Analysis 12 January 24

Alphabet Inc.(GOOGL:NASDAQ) Elliott Wave Technical Analysis 12 January 24

Alphabet Inc.(GOOGL: NASDAQ) Elliott Wave Technical Analysis with 4h and 1h Chart dated 12 January 2...

Read More >

$1 for 2 Weeks

then $29 a month!

What a Special Offer!

Trade Recommendations

Unleash the power of deversified trading with our comprehensive portfolio, covering 250+ markets:

  • Stock Trades
  • Crypto Trades
  • Forex Trades
  • Commodity Trades
Elliott Wave Analysis

Gain a competitive edge with expert insights and AI-powered Elliott Wave charting into:

  • Global Indices
  • US Stocks & ASX Stocks
  • Forex & Crypto
  • Commodities
Top-Notch Trading Tools

Equip yourself with the tools of success:

  • Real-time Chat rooms
  • Elliott Wave Algorithm
  • Portfolio tools
  • TradingLevels
  • Screener
  • Trading Game
7 Elliott Wave Analysts

Stay ahead of the market with daily charts and insightful videos
Your secret to strategic trading!

JOIN HERE


Welcome to TradingLounge (ASIC A.R.No. 321187), specialists in trades, trading education and technical analysis, covering stocks, indices, commodities, forex and cryptocurrencies.

When you join TradingLounge you have access to everything we offer, including trade tools, educational content and a social platform to chat with like-minded investors.

Read more

@Copyright 2024 by tradinglounge.com

Contact Us

Australian no: 02 4787 6020

International no: +61 (2) 47876020

Pay with:

Find us on