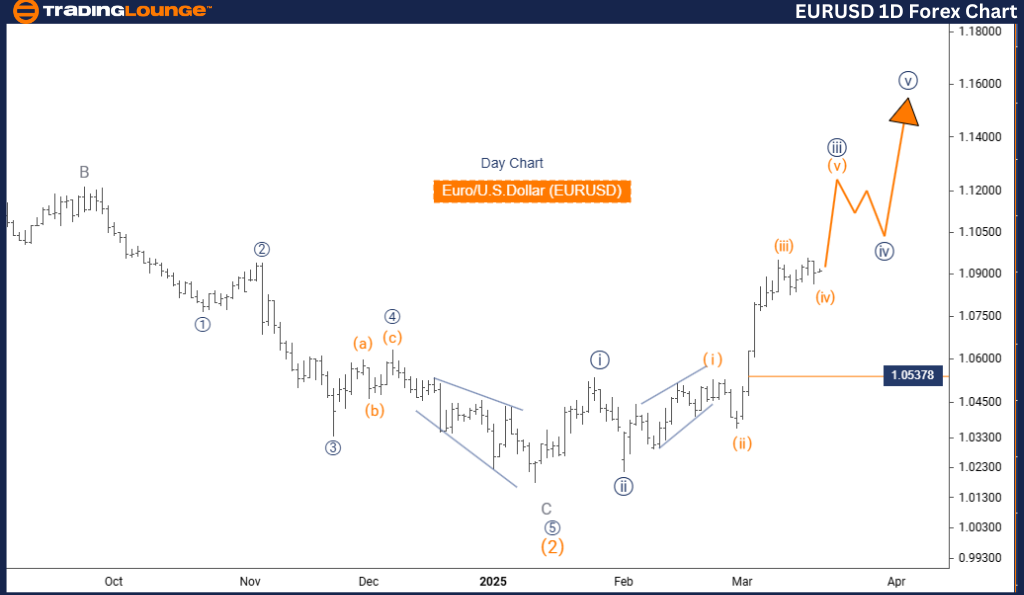
Euro/ U.S. Dollar (EURUSD) Elliott Wave Analysis – Trading Lounge Daily Chart Analysis
EURUSD Elliott Wave Technical Analysis
Function: Bullish Trend
Mode: Impulsive
Structure: Navy Blue Wave 3
Position: Gray Wave 1
Next Lower Degree Direction: Navy Blue Wave 4
Wave Cancelation Level: 1.05378
Analysis Details:
The EURUSD Elliott Wave Analysis for the daily chart offers a comprehensive evaluation of the Euro/US Dollar currency pair, focusing on the current trend and potential price movements.
- The market remains in a bullish trend phase, primarily driven by impulsive waves rather than corrective ones.
- Navy Blue Wave 3 is the focal point, forming a crucial part of the broader Elliott Wave cycle within Gray Wave 1.
- Navy Blue Wave 2 appears complete, signaling the beginning of Navy Blue Wave 3, which is expected to generate strong directional movements.
- Once Navy Blue Wave 3 is completed, traders should anticipate the emergence of Navy Blue Wave 4, marking the next corrective phase.
- The wave cancellation level is set at 1.05378. A price drop below this level would invalidate the current wave structure, potentially altering the market outlook.
Trading Considerations:
Traders should closely monitor the development of Navy Blue Wave 3, preparing for its transition into Navy Blue Wave 4. Understanding these Elliott Wave patterns is essential for making accurate market forecasts.
- The daily chart analysis provides a long-term market perspective, helping traders align their strategies with macro trends and potential reversals.
- Recognizing key price levels and wave completions ensures traders can make informed decisions, capitalizing on entry and exit points effectively.
- A well-structured approach to wave tracking enhances trade execution and risk management, ensuring readiness for market fluctuations.
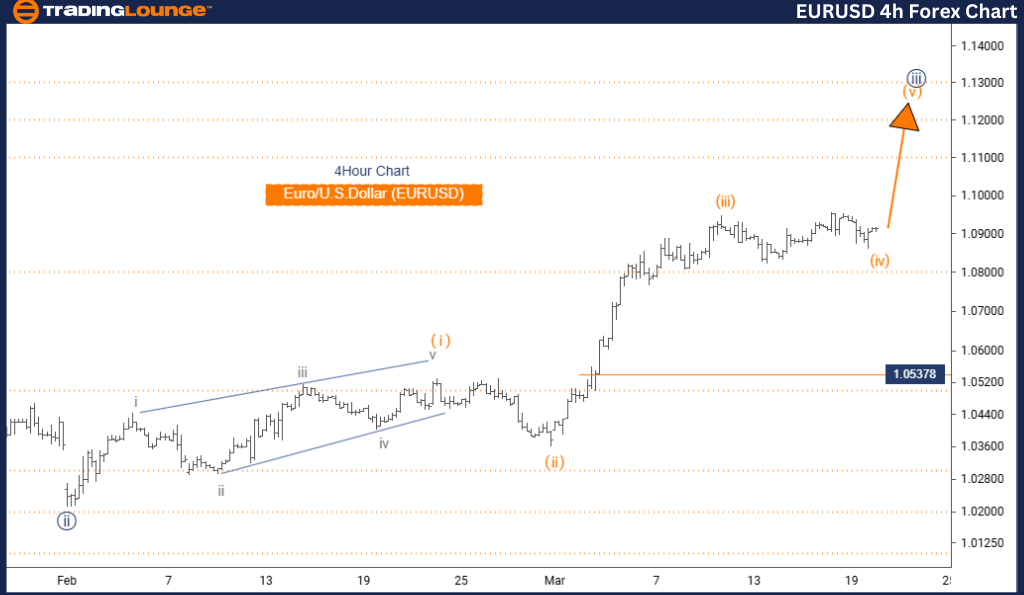
Euro/ U.S. Dollar (EURUSD) Elliott Wave Analysis – Trading Lounge 4-Hour Chart Analysis
EURUSD Elliott Wave Technical Analysis
Function: Bullish Trend
Mode: Impulsive
Structure: Orange Wave 5
Position: Navy Blue Wave 3
Next Lower Degree Direction: Navy Blue Wave 4
Wave Cancelation Level: 1.05378
Analysis Details:
The EURUSD Elliott Wave Analysis for the 4-hour chart provides a detailed perspective on the Euro/US Dollar currency pair, focusing on short-term trends and potential price movements.
- The market remains in a bullish phase, characterized by impulsive waves rather than corrective ones.
- Orange Wave 5 is the primary focus, forming within Navy Blue Wave 3, confirming its position in the broader wave cycle.
- Orange Wave 4 appears to have completed, signaling the market’s transition into Orange Wave 5, which is anticipated to drive strong directional shifts.
- After Orange Wave 5 concludes, traders should prepare for Navy Blue Wave 4, marking the next corrective phase.
- The critical invalidation level remains 1.05378. If prices break below this level, the current wave structure would be invalidated, suggesting a possible market shift.
Trading Considerations:
Traders should carefully observe the progress of Orange Wave 5, preparing for the potential transition into Navy Blue Wave 4.
- The 4-hour chart analysis offers short-term trading insights, allowing traders to align strategies with immediate market movements.
- Recognizing wave patterns and key price levels empowers traders to make data-driven decisions, enhancing their ability to spot trend completions and upcoming shifts.
- This structured approach ensures traders can adapt strategies effectively, staying prepared for market fluctuations and new opportunities.
Technical Analyst: Malik Awais
Source: Visit Tradinglounge.com and learn from the Experts Join TradingLounge Here
Previous: USDCHF Elliott Wave Technical Analysis
VALUE Offer - Buy 1 Month & Get 3 Months!Click here
Access 7 Analysts Over 200 Markets Covered. Chat Room With Support