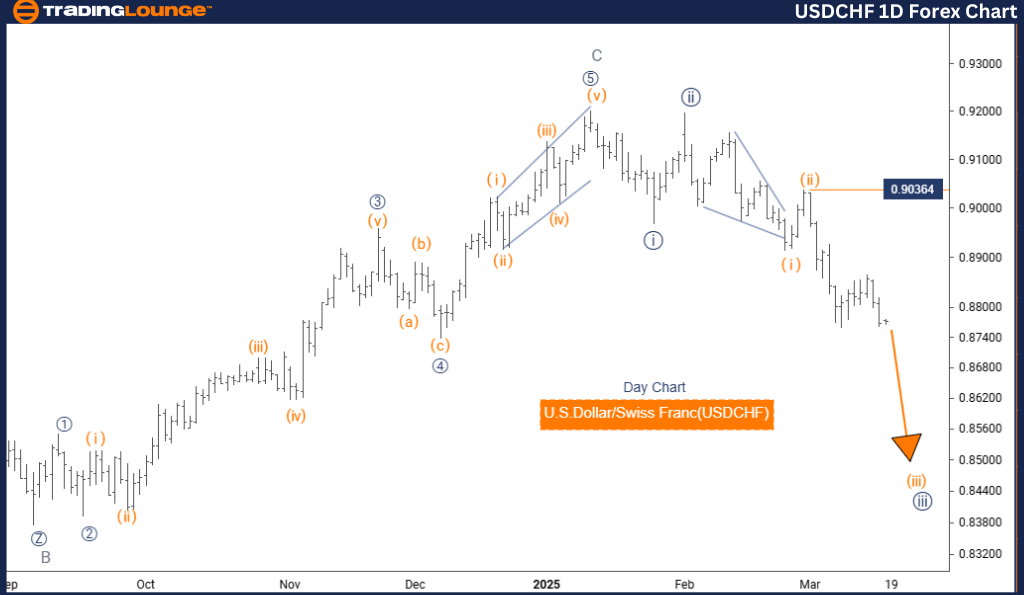
U.S. Dollar / Swiss Franc (USDCHF) Elliott Wave Analysis – Trading Lounge Day Chart
USDCHF Elliott Wave Technical Analysis
Function: Bearish Trend
Mode: Impulsive
Structure: Orange Wave 3
Position: Navy Blue Wave 3
Direction Next Higher Degree: Orange Wave 4
Wave Cancel Invalidation Level: 0.90364
Analysis Overview
The USDCHF Elliott Wave analysis for the daily chart offers a detailed evaluation of the U.S. Dollar/Swiss Franc currency pair, highlighting its current trend and potential future price movements.
- The market remains bearish, dominated by impulsive price action rather than corrective waves.
- The primary wave structure being analyzed is Orange Wave 3, forming a part of a larger wave pattern within Navy Blue Wave 3.
- The completion of Orange Wave 2 signals the transition into Orange Wave 3, which is expected to be strong and directional before the next significant trend emerges.
- The next higher-degree wave, Orange Wave 4, will develop once Orange Wave 3 concludes.
Key Levels & Trading Considerations
- Invalidation Level: 0.90364
If the price moves beyond this level, the current wave count will be invalidated, suggesting a possible shift in market dynamics.
- Traders should monitor Orange Wave 3 closely, anticipating the transition into Orange Wave 4.
Trading Insights
This daily chart analysis provides a structured trading approach, offering traders valuable insights into trend progression.
- Wave structures and key price levels play a critical role in making informed trading decisions.
- Recognizing wave completions and trend transitions allows traders to anticipate future price shifts effectively.
- Longer-term trends provide traders with a strategic advantage, ensuring alignment with major market movements and reversal points.
Conclusion
This USDCHF Elliott Wave analysis delivers a comprehensive framework for analyzing price action and guiding traders through the ongoing impulsive phase. By focusing on wave structures, key levels, and trend transitions, traders can enhance their market positioning and decision-making strategies.
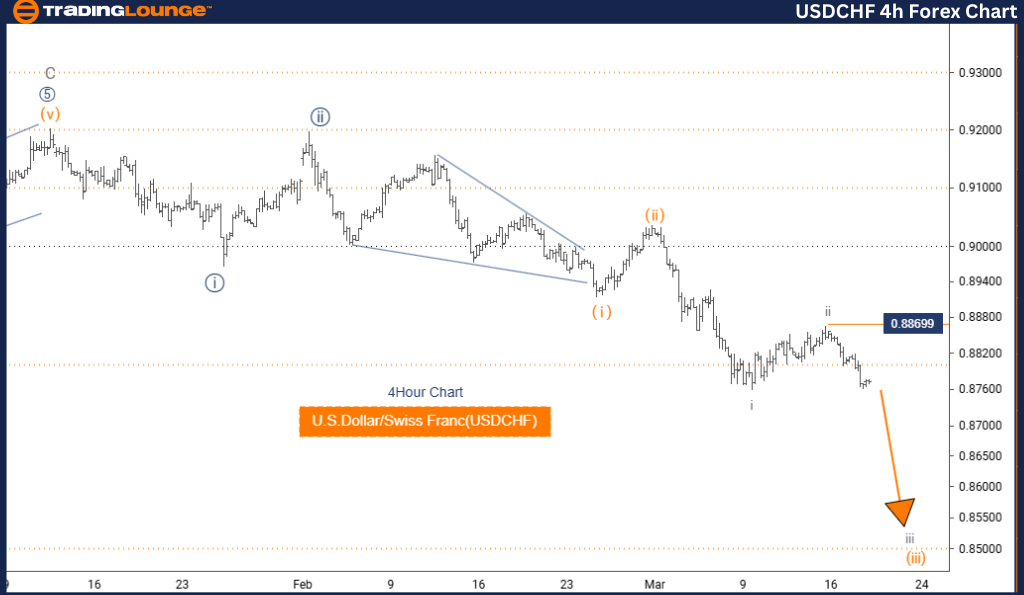
U.S. Dollar / Swiss Franc (USDCHF) Elliott Wave Analysis – Trading Lounge 4-Hour Chart
USDCHF Elliott Wave Technical Analysis
Function: Bearish Trend
Mode: Impulsive
Structure: Gray Wave 3
Position: Orange Wave 3
Direction Next Lower Degree: Gray Wave 3 (Started)
Wave Cancel Invalidation Level: 0.90364
Analysis Overview
The USDCHF Elliott Wave analysis for the 4-hour chart examines the short-term trend and future price movements of the U.S. Dollar/Swiss Franc currency pair.
- The market remains in a bearish phase, dominated by impulsive price action rather than corrective movements.
- The primary structure being analyzed is Gray Wave 3, which exists within a larger wave formation under Orange Wave 3.
- The completion of Gray Wave 2 confirms the transition into Gray Wave 3, expected to be strong and directional, pushing the price further downward before the next significant move.
- The next lower-degree wave, Gray Wave 3, has already begun and is anticipated to continue declining.
Key Levels & Trading Considerations
- Invalidation Level: 0.90364
A break above this level would invalidate the current wave count, signaling a potential market reversal.
- Traders should closely monitor Gray Wave 3, preparing for further downward movements in line with the bearish trend.
Trading Insights
This 4-hour chart analysis provides a short-term perspective on market behavior, helping traders fine-tune their trading strategies based on immediate price movements.
- Wave patterns and key price levels are essential for making well-informed trading decisions.
- Identifying wave completions and trend transitions allows traders to anticipate price shifts accurately.
- Adopting this analytical approach ensures traders can adjust their strategies effectively in response to evolving market conditions.
Conclusion
This USDCHF Elliott Wave analysis provides a structured methodology for interpreting price action in a bearish market. By focusing on wave structures, key price levels, and trend transitions, traders can navigate market fluctuations with confidence and maximize their trading opportunities.
Technical Analyst: Malik Awais
Source: Visit Tradinglounge.com and learn from the Experts Join TradingLounge Here
Previous: GBPAUD Elliott Wave Technical Analysis
VALUE Offer - Buy 1 Month & Get 3 Months!Click here
Access 7 Analysts Over 200 Markets Covered. Chat Room With Support