Cocoa Commodity Elliott Wave Analysis

Function - Counter-trend

Mode - Corrective

Structure - Not yet defined

Position - Blue wave ‘b’

Direction - Blue wave ‘b’ is still in play

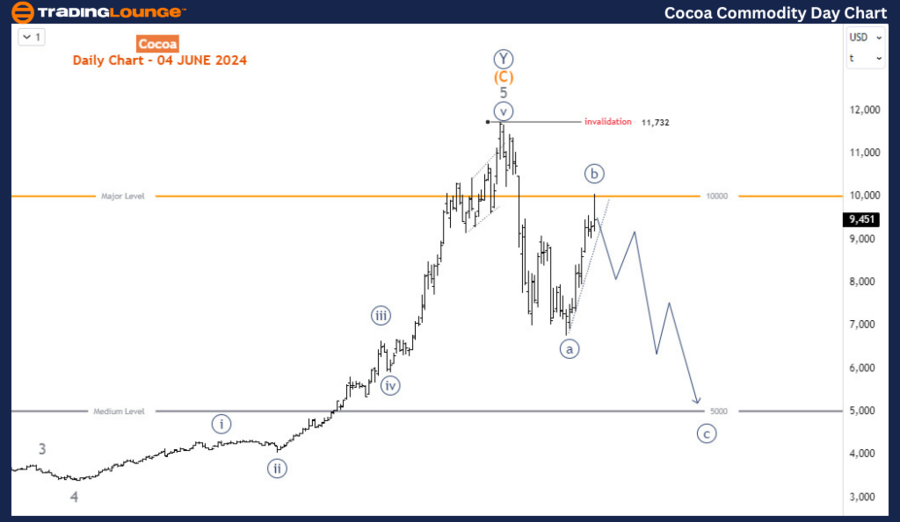
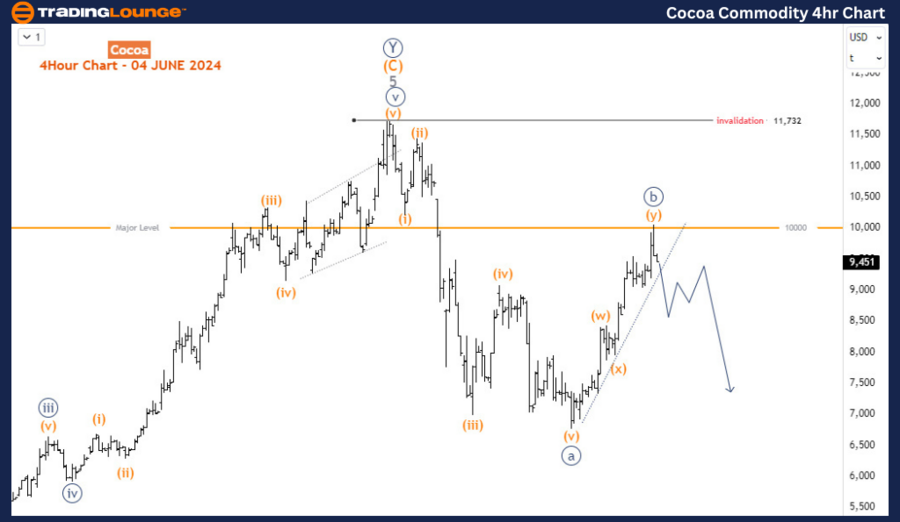
Details -  As the price reached the 30 major level. The circled wave b could have completed a double zigzag. However, the price needs to break below the trendline strongly before expecting further decline for the circled wave c. However, if the 10000 major level is breached upside down, there is a risk of invalidation above 11732.

Cocoa Elliott Wave Technical Analysis

As the price reached the 30 major level, the circled wave b could have completed a double zigzag. However, the price needs to break below the trendline strongly before expecting further decline for the circled wave c. If the 10000 major level is breached upside instead, then there is a risk of invalidation above 11732.

Since mid-May 2024, Cocoa has gained about 40%. In other words, it has recovered over 60% of the sell-off from 19 April. Altogether, we can view the decline from 19 April as a retracement of the bullish trend that started in October 2022.

Cocoa Commodity Daily Chart Analysis

On the daily chart, a bullish impulse wave structure that emerged from October 2022 ended at the peak of April 2024. As per Elliott wave theory, an impulse in 5-waves is followed by a 3-wave correction against the direction of the impulse. Thus, when the impulse rally ended at 11732, a sharp decline followed, which should at least complete a 3-wave correction. In this case, the corrective sub-waves are labeled a-b-c (circled). Price seems to be completing wave b at the 10000 major level and if price has truly found resistance there, we should see another leg lower for wave c toward the 5000 major level. However, if the current surge is not resisted below 10000 but instead breaches that major level to continue higher above the 11732 high, then the bullish trend from October 2022 will continue higher.
Cocoa-Commodity-day-...


Cocoa Commodity 4-Hour Chart Analysis

On the H4 chart, we reckon wave b (circled) has completed a double zigzag. However, the only concern is the steepness of the pattern which could make for an alternative where the current surge could be the first leg of wave b (circled). If that’s the case, then the bearish reaction from 10000 will be a corrective structure leading to the last leg above 10000 before wave b completes below the 11732 high. While having the alternative in mind, the preferred count expects wave b to have ended at 10000 and wave c to emerge downwards in an impulse below the 20th May low.

Technical Analyst: Sanmi Adeagbo

Source: visit Tradinglounge.com and learn From the Experts Join TradingLounge Here 

See Previous: Gold (XAUUSD) Elliott Wave Technical Analysis

Special Trial Offer - 0.76 Cents a Day for 3 Months! Click here

Access 7 Analysts Over 170 Markets Covered. Chat Room With Support
Cocoa-Commodity-4Hr-...

Related

BHP Group Limited Utilizes Elliott Wave theory to Provide Detailed Insights into BHP Stock Trends, Price Predictions

BHP Group Limited Utilizes Elliott Wave theory to Provide Detailed Insights into BHP Stock Trends, Price Predictions

This comprehensive analysis of ASX: BHP Group Limited utilizes Elliott Wave theory to provide detail...

Read More >
Vanguard Australian Shares Index ETFA and V300AEQ ETF UNITS – VAS Stock Analysis & Elliott Wave Technical Forecast

Vanguard Australian Shares Index ETFA and V300AEQ ETF UNITS – VAS Stock Analysis & Elliott Wave Technical Forecast

This article provides an in-depth Elliott Wave analysis of the ASX: V300AEQ ETF – VAS, focusing on ...

Read More >
USDCAD Elliott Wave Forecast Reveals Bearish Trend with Key Impulse structures guiding the outlook and Trading Insights

USDCAD Elliott Wave Forecast Reveals Bearish Trend with Key Impulse structures guiding the outlook and Trading Insights

This analysis of the USDCAD using Elliott Wave theory forecasts a continued bearish trend with impul...

Read More >
British Pound/Japanese Yen(GBPJPY) Elliott Wave Technical Analysis 6 November 23

British Pound/Japanese Yen(GBPJPY) Elliott Wave Technical Analysis 6 November 23

In conclusion, the GBP/JPY Elliott Wave Analysis on the 4-hour chart, dated 6 November 23, paints a ...

Read More >
Identifies the current wave structure with index market analysis: FTSE 100 (UK) Elliott Wave Technical Analysis

Identifies the current wave structure with index market analysis: FTSE 100 (UK) Elliott Wave Technical Analysis

This article provides an in-depth Elliott Wave analysis of the FTSE 100 market on both daily and wee...

Read More >
QUALCOMM (QCOM) Technical Analysis Reveals Bullish Elliott Wave Setup with Price Prediction and Trend Forecast on Charts

QUALCOMM (QCOM) Technical Analysis Reveals Bullish Elliott Wave Setup with Price Prediction and Trend Forecast on Charts

This technical analysis of QUALCOMM (QCOM) uses Elliott Wave Theory to forecast bullish trends and p...

Read More >

$1 for 2 Weeks

then $29 a month!

What a Special Offer!

Trade Recommendations

Unleash the power of deversified trading with our comprehensive portfolio, covering 250+ markets:

  • Stock Trades
  • Crypto Trades
  • Forex Trades
  • Commodity Trades
Elliott Wave Analysis

Gain a competitive edge with expert insights and AI-powered Elliott Wave charting into:

  • Global Indices
  • US Stocks & ASX Stocks
  • Forex & Crypto
  • Commodities
Top-Notch Trading Tools

Equip yourself with the tools of success:

  • Real-time Chat rooms
  • Elliott Wave Algorithm
  • Portfolio tools
  • TradingLevels
  • Screener
  • Trading Game
7 Elliott Wave Analysts

Stay ahead of the market with daily charts and insightful videos
Your secret to strategic trading!

JOIN HERE


Welcome to TradingLounge (ASIC A.R.No. 321187), specialists in trades, trading education and technical analysis, covering stocks, indices, commodities, forex and cryptocurrencies.

When you join TradingLounge you have access to everything we offer, including trade tools, educational content and a social platform to chat with like-minded investors.

Read more

@Copyright 2024 by tradinglounge.com

Contact Us

Australian no: 02 4787 6020

International no: +61 (2) 47876020

Pay with:

Find us on