06Dec

Elliott Wave Technical Analysis of Bovespa Index: Bullish Trends, Key Levels, Wave Structures, and Insights for Traders’ Market Gains.

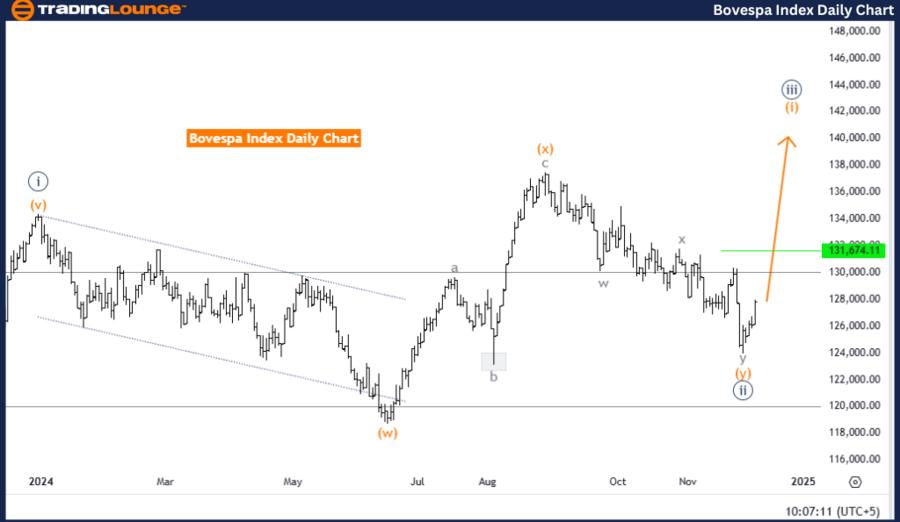
Bovespa Index Elliott Wave Analysis - Trading Lounge Day Chart

Bovespa Index Elliott Wave Technical Analysis

Function: Bullish Trend

Mode: Impulsive

Structure: Orange Wave 1

Position: Navy Blue Wave 3

Direction Next Higher Degrees: Orange Wave 1 (Initiated)

Details: Navy Blue Wave 2 appears complete; Orange Wave 1 of Navy Blue Wave 3 is underway.

Analysis Overview

The daily chart of the Bovespa Index reveals a bullish Elliott Wave structure. The ongoing wave sequence, identified as Orange Wave 1, is a part of Navy Blue Wave 3, signaling an impulsive phase in the market. This setup highlights a continuation of the upward trend, suggesting robust market dynamics.

The conclusion of Navy Blue Wave 2 has initiated Orange Wave 1, which now drives the early stages of the impulsive sequence within Navy Blue Wave 3. This aligns with the principles of Elliott Wave Theory, forecasting a strong bullish trend supported by the structure's momentum.

Insights for Traders

This bullish Elliott Wave analysis provides actionable insights for traders. The progression of Orange Wave 1 within Navy Blue Wave 3 suggests sustained upward momentum, presenting opportunities for potential market gains. Traders can leverage this structure to align with the unfolding impulsive phase for informed decision-making.

Bovespa-index-daily-...

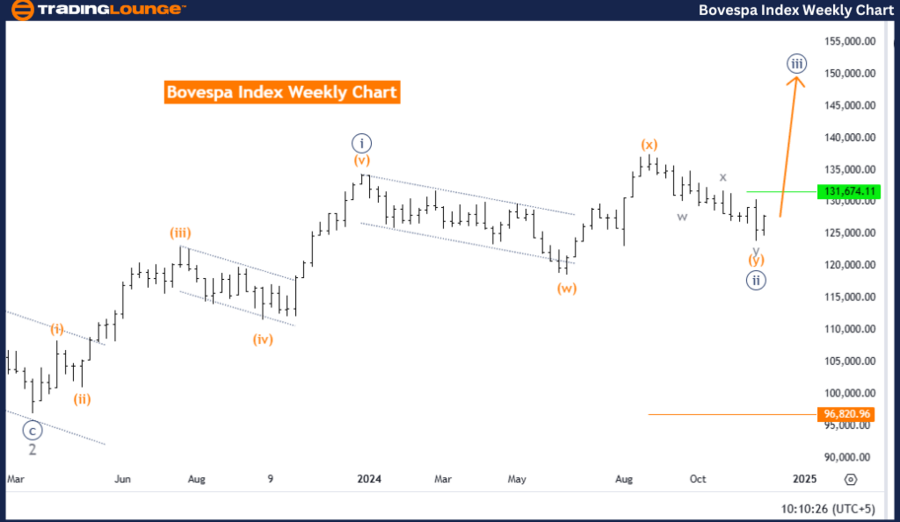
Bovespa Index Elliott Wave Analysis - Trading Lounge Weekly Chart

Bovespa Index Elliott Wave Technical Analysis

Function: Bullish Trend

Mode: Impulsive

Structure: Navy Blue Wave 3

Position: Gray Wave 3

Direction Next Higher Degrees: Navy Blue Wave 3 (Initiated)

Details: Navy Blue Wave 2 appears complete; Navy Blue Wave 3 is now active.

Wave Cancel Invalid Level: 96,820.96

Analysis Overview

The weekly chart of the Bovespa Index provides further confirmation of the bullish trend through Elliott Wave analysis. The wave sequence is defined as Navy Blue Wave 3, which forms a key component of the broader impulsive movement. Gray Wave 3 is currently advancing within this structure, signaling continued upward momentum in the market.

The conclusion of Navy Blue Wave 2 has allowed the transition into Navy Blue Wave 3, a hallmark of Elliott Wave Theory's impulsive wave phases. The ongoing development of Navy Blue Wave 3 indicates a period of strong bullish momentum, offering the potential for further upward progression.

Key Levels and Considerations

The invalidation level for the current wave count is identified at 96,820.96. A break below this threshold would necessitate a reevaluation of the wave structure, possibly indicating a deviation from the expected bullish trajectory.

Insights for Traders

The analysis of Navy Blue Wave 3 provides a strategic framework for understanding the ongoing bullish trend. By monitoring critical levels and the impulsive sequence's progression, traders can position themselves to capitalize on potential market gains as this phase unfolds. The persistence of upward momentum offers a favorable outlook for trading opportunities.

Technical Analyst: Malik Awais

Source: visit Tradinglounge.com and learn From the Experts Join TradingLounge Here 

Previous: IBEX 35 Elliott Wave Technical Analysis  

VALUE Offer - Buy 1 Month & Get 3 Months!Click here

Access 7 Analysts Over 200 Markets Covered. Chat Room With Support

Bovespa-index-weekly...Bovespa-index-weekly...

Related

Offers valuable insights into Spotify Technology S.A., (SPOT) Stocks Elliott Wave Technical Analysis

Offers valuable insights into Spotify Technology S.A., (SPOT) Stocks Elliott Wave Technical Analysis

Our detailed SPOT Elliott Wave analysis offers valuable insights into Spotify Technology S.A. stock....

Read More >
Boost your Trading with NIFTY 50 (INDIA) Elliott Wave Technical Analysis Help Market Prediction and the best Strategies

Boost your Trading with NIFTY 50 (INDIA) Elliott Wave Technical Analysis Help Market Prediction and the best Strategies

Stay ahead in the market with our comprehensive NIFTY 50 trading analysis. Utilizing Elliott Wave th...

Read More >
British Pound/U.S.Dollar (GBPUSD) Elliott Wave Technical Analysis 19 October 23

British Pound/U.S.Dollar (GBPUSD) Elliott Wave Technical Analysis 19 October 23

In summary, the GBPUSD Elliott Wave Analysis for 19 October 23, delivers valuable insights into the ...

Read More >
VAS Stock Analysis & Elliott Wave Technical Forecast | Vanguard Strategic Trading Approaches to Optimize Investment Strategy

VAS Stock Analysis & Elliott Wave Technical Forecast | Vanguard Strategic Trading Approaches to Optimize Investment Strategy

Our detailed analysis of ASX V300AEQ ETF provides an in-depth look at the current market trends usin...

Read More >
NZDUSD Forex Market: Expert New Zealand Dollar/ U.S. Dollar Elliott Wave Technical Analysis and Trading Strategies

NZDUSD Forex Market: Expert New Zealand Dollar/ U.S. Dollar Elliott Wave Technical Analysis and Trading Strategies

Get an in-depth analysis of NZDUSD using Elliott Wave theory. Our analysis covers the current trend,...

Read More >
DOGEUSD Elliott Wave Technical Analysis - Dogecoin’s Potential Uptrend Signals, Trading Strategies, and Market Movements

DOGEUSD Elliott Wave Technical Analysis - Dogecoin’s Potential Uptrend Signals, Trading Strategies, and Market Movements

This article provides an in-depth DOGEUSD Elliott Wave analysis, including Dogecoin’s price forecas...

Read More >

Buy 1 Month

Get 3 Months!

Special Offer:

Trade Recommendations

Unleash the power of deversified trading with our comprehensive portfolio, covering:

  • Stock Trades
  • Crypto Trades
  • Forex Trades
  • Commodity Trades
Elliott Wave Analysis

Gain a competive edge with expert insights in to:

  • Global Indices
  • US Stocks & ASX Stocks
  • Forex & Crypto
  • Commodities
Top-Notch Trading Tools

Equip yourself with the tools of success:

  • Social Chat
  • Elliott Wave Algorithm
  • Screener
  • TradingLevels
  • Trading Game
7 Elliott Wave Analysts

Stay ahead of the market with daily charts and insightful videos
-Your secret to strategic trading!

JOIN HERE


Welcome to TradingLounge (ASIC A.R.No. 321187), specialists in trades, trading education and technical analysis, covering stocks, indices, commodities, forex and cryptocurrencies.

When you join TradingLounge you have access to everything we offer, including trade tools, educational content and a social platform to chat with like-minded investors.

Read more

@Copyright 2024 by tradinglounge.com

Contact Us

Australian no: 02 4787 6020

International no: +61 (2) 47876020

Pay with:

Find us on