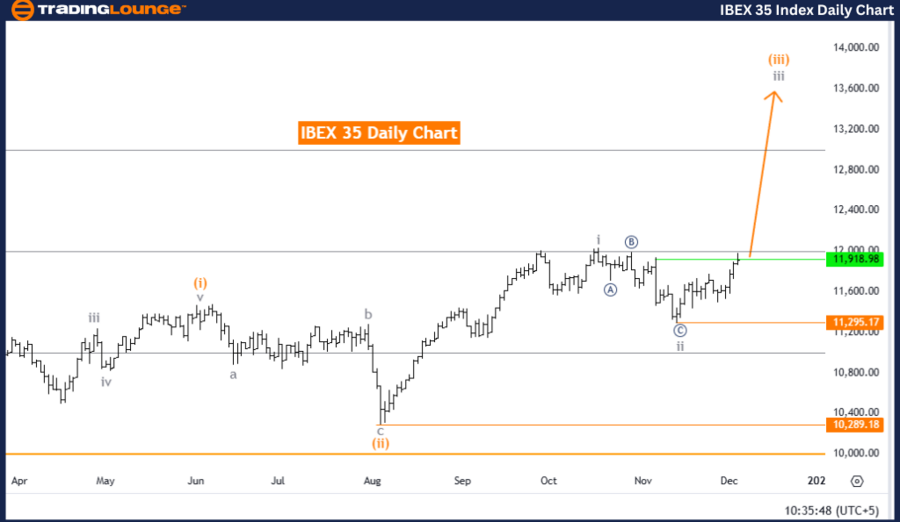
IBEX 35 (Spain) Elliott Wave Analysis - Trading Lounge Day Chart
IBEX 35 Elliott Wave Technical Analysis
Function: Bullish Trend
Mode: Impulsive
Structure: Gray Wave 3
Position: Orange Wave 3
Direction (Next Higher Degrees): Gray Wave 3 (Initiated)
Details: Gray Wave 2 appears completed, and Gray Wave 3 within Orange Wave 3 is in progress.
Wave Cancel Invalidation Level: 11,295.17
Analysis Overview
The daily chart for IBEX 35 indicates a bullish trend through Elliott Wave analysis. The current wave structure identifies Gray Wave 3, forming part of an impulsive sequence. Within this framework, Orange Wave 3 is advancing, signaling sustained upward momentum.
Wave Analysis and Progression
-
Completion of Gray Wave 2:
Analysis suggests the completion of Gray Wave 2, marking the initiation of Gray Wave 3 within Orange Wave 3. This phase aligns with Elliott Wave Theory, which leverages wave structures to predict market behavior.
-
Development of Gray Wave 3:
The impulsive progression of Gray Wave 3 reflects a strong bullish trend, indicating further potential for market gains as the wave continues.
Invalidation Level
The critical invalidation level is identified at 11,295.17. If the market falls below this threshold, the current wave structure will require reassessment, potentially signaling a deviation from the expected bullish scenario.
Trading Insights
This Elliott Wave analysis provides traders with actionable insights into the bullish trend in the IBEX 35 market. By identifying key levels and directional trends, the analysis supports informed trading strategies. The outlined invalidation level acts as a crucial benchmark for monitoring potential market shifts.
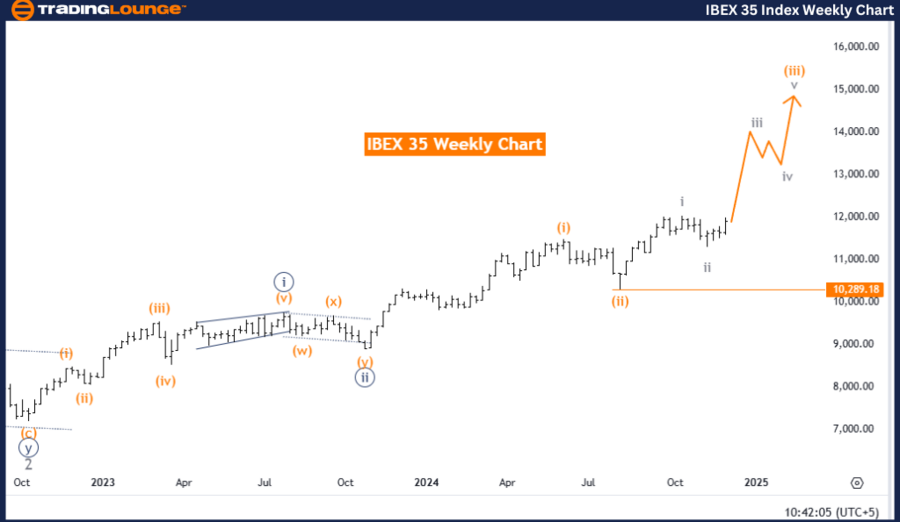
IBEX 35 (Spain) Elliott Wave Analysis - Trading Lounge Weekly Chart
IBEX 35 Elliott Wave Technical Analysis
Function: Bullish Trend
Mode: Impulsive
Structure: Gray Wave 3
Position: Orange Wave 3
Direction (Next Higher Degrees): Gray Wave 3 (Initiated)
Details: Gray Wave 2 appears completed, and Gray Wave 3 within Orange Wave 3 is in progress.
Wave Cancel Invalidation Level: 10,289.18
Analysis Overview
The weekly chart analysis for IBEX 35 highlights a bullish trend through Elliott Wave analysis. The wave structure identifies Gray Wave 3, which is part of a larger impulsive sequence. Within this setup, Orange Wave 3 is advancing, underscoring continued upward momentum.
Wave Analysis and Progression
-
Completion of Gray Wave 2:
Evidence suggests the conclusion of Gray Wave 2, leading to the ongoing progression of Gray Wave 3 within Orange Wave 3. This phase adheres to Elliott Wave Theory principles, utilizing wave structures to project future market movements.
-
Development of Gray Wave 3:
The impulsive nature of this wave reflects a robust bullish trajectory, with room for further gains as the wave unfolds.
Invalidation Level
The critical invalidation level is set at 10,289.18. A breach below this point necessitates reassessment of the wave structure, possibly indicating a departure from the current bullish outlook.
Trading Insights
This weekly Elliott Wave analysis offers a detailed framework for traders to interpret the IBEX 35’s bullish momentum. By focusing on critical levels and directional trends, it outlines the continuation of upward market movement. The provided invalidation level serves as a vital reference point for monitoring potential deviations.
Technical Analyst: Malik Awais
Source: visit Tradinglounge.com and learn From the Experts Join TradingLounge Here
Previous: NIFTY 50 (India) Elliott Wave Technical Analysis
VALUE Offer - Buy 1 Month & Get 3 Months!Click here
Access 7 Analysts Over 200 Markets Covered. Chat Room With Support