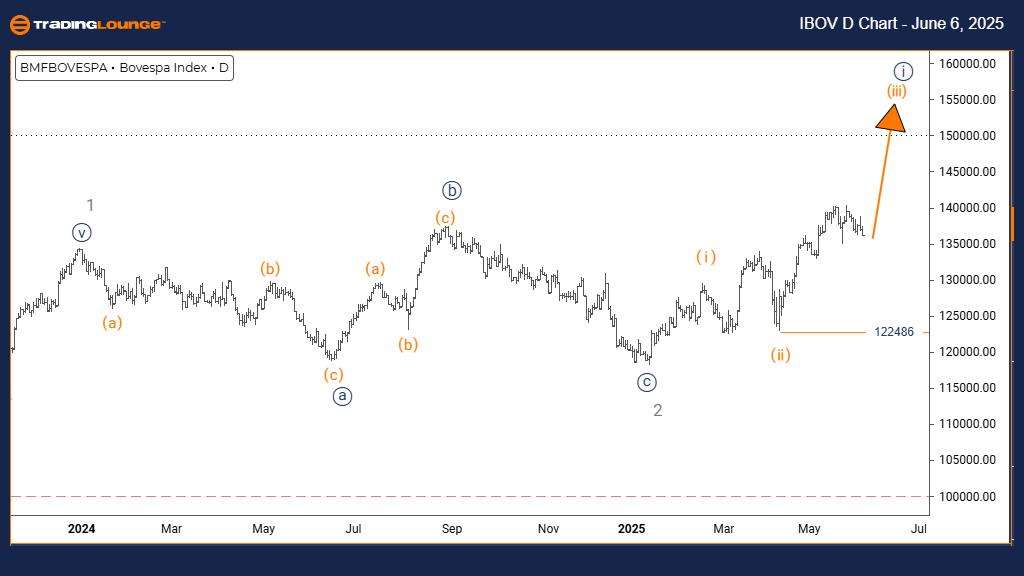
Bovespa Index Elliott Wave Analysis – Trading Lounge Day Chart
Bovespa Index Day Chart Analysis
Bovespa Index Elliott Wave Technical Analysis
FUNCTION: Bullish Market Trend
MODE: Impulsive Movement
STRUCTURE: Orange Wave 3 Formation
POSITION: Navy Blue Wave 1 Progression
DIRECTION NEXT LOWER DEGREES: Orange Wave 4 Expected
DETAILS: Completion of Orange Wave 2 confirmed; Orange Wave 3 currently advancing
Wave Cancel Invalidation Level: 122486
The daily Elliott Wave analysis of the Bovespa Index signals a persistent bullish trend, aligning with an impulsive wave structure. As Orange Wave 2 finishes, Orange Wave 3 begins its upward course within the larger Navy Blue Wave 1 context. This suggests the market is in a high-momentum segment typical of Elliott Wave’s third wave formations.
The current impulsive move reflects strong buying momentum and sustained investor confidence. As long as the Bovespa Index remains above the invalidation level of 122486, the bullish outlook stands firm. A break below this threshold would nullify the current wave count and potentially indicate a corrective shift or trend reversal.
Traders and analysts following Elliott Wave theory can expect Orange Wave 4 to follow once Wave 3 completes. Watch for confirmation signals of continuation and maintain robust risk management, considering the advanced position of the wave sequence.
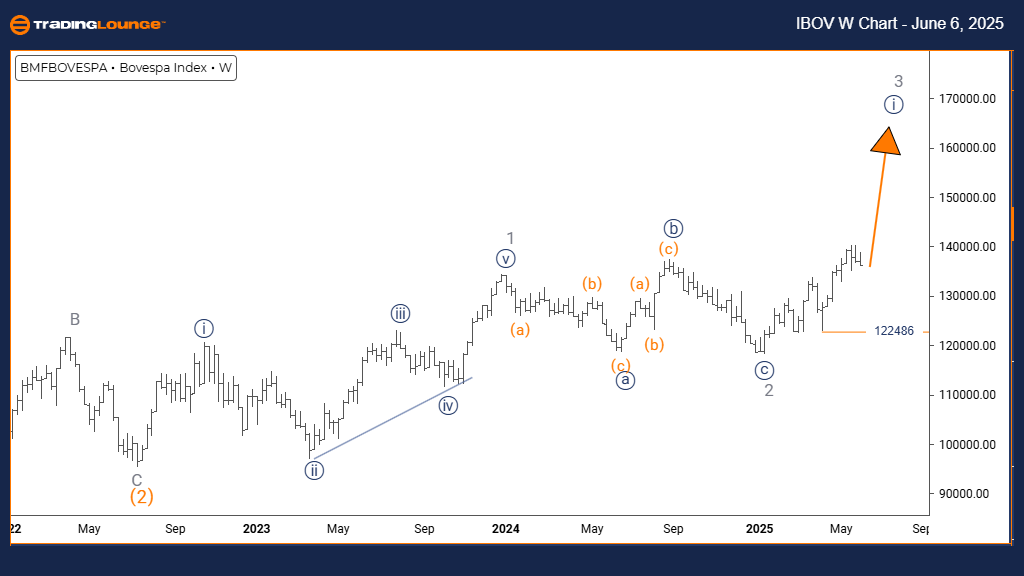
Bovespa Index Elliott Wave Analysis – Trading Lounge Weekly Chart
Bovespa Index Elliott Wave Technical Analysis
FUNCTION: Sustained Bullish Trend
MODE: Impulsive Wave Sequence
STRUCTURE: Navy Blue Wave 1 Formation
POSITION: Gray Wave 3 Development
DIRECTION NEXT LOWER DEGREES: Navy Blue Wave 2 Anticipated
DETAILS: Gray Wave 2 appears completed; Navy Blue Wave 1 now emerging
Wave Cancel Invalidation Level: 122486
On the weekly chart, the Bovespa Index displays continued bullish dynamics. The Elliott Wave count shows Navy Blue Wave 1 gaining traction within a larger Gray Wave 3 impulsive move. This signals the early stage of a potential long-term rally, as Gray Wave 2 correction has likely ended.
The upward motion of Navy Blue Wave 1 supports a bullish technical outlook, with additional gains expected. Only a drop below the invalidation point of 122486 would challenge this structure and necessitate a reassessment of the wave count.
Investors and swing traders should monitor the chart for signs of continuation before Navy Blue Wave 2 initiates a corrective phase. This setup provides a strong foundation for trading strategies that favor long positions, assuming invalidation levels remain unbreached.
Technical Analyst: Malik Awais
Source: Visit Tradinglounge.com and learn from the Experts. Join TradingLounge Here
Previous: Shanghai Composite Elliott Wave Technical Analysis
VALUE Offer - Buy 1 Month & Get 3 Months!Click here
Access 7 Analysts Over 200 Markets Covered. Chat Room With Support