EURUSD Elliott Wave Analysis | Trading Lounge – Day Chart
Euro/ U.S. Dollar (EURUSD) Day Chart Analysis
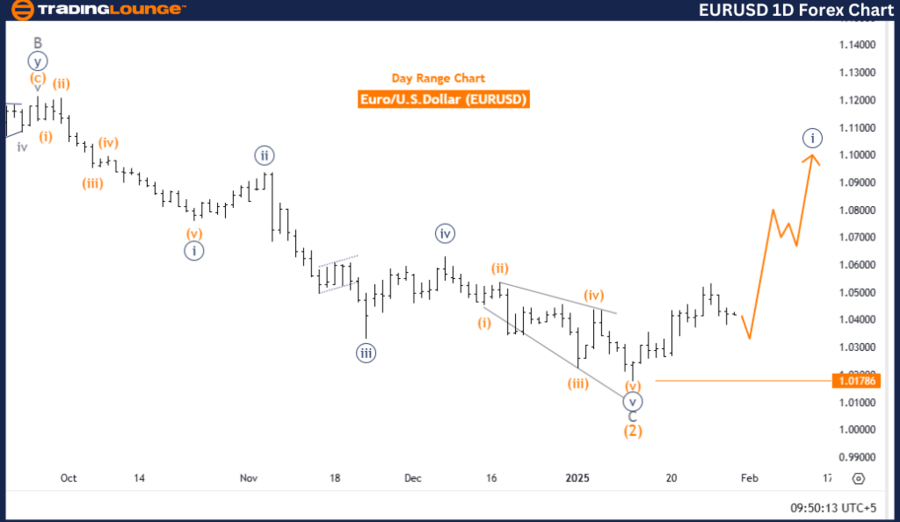
EURUSD Elliott Wave Technical Analysis
- Function: Bullish Trend
- Mode: Impulsive
- Structure: Navy Blue Wave 1
- Position: Gray Wave 1
- Direction Next Higher Degrees: Navy Blue Wave (Started)
- Details: Navy Blue Wave 1 of Gray Wave 1 indicates the start of a new trend.
- Wave Cancellation Invalid Level: 1.01786
The EURUSD Elliott Wave analysis on the daily chart provides an in-depth technical outlook for the Euro/US Dollar currency pair. The current market phase is identified as a bullish trend, suggesting strong upward momentum. The impulsive mode confirms that the market is in a sustained directional movement rather than a consolidation or correction.
The wave structure is labeled as Navy Blue Wave 1, forming part of a larger Elliott Wave cycle. This wave is embedded within Gray Wave 1, marking it as a sub-wave of a higher-degree trend.
At present, Navy Blue Wave 1 of Gray Wave 1 is actively unfolding, signaling the initiation of a new bullish cycle. This suggests that the market is in the early stages of a major upward movement. The next higher-degree trend aligns with the formation of Navy Blue Wave, reinforcing the overall bullish market structure.
A critical aspect of this analysis is the wave cancellation invalid level, set at 1.01786. If the price moves below this threshold, the current wave count becomes invalid, necessitating a reassessment of the market outlook.
Summary
- EURUSD is currently in an impulsive bullish phase, marked as Navy Blue Wave 1, within the larger Gray Wave 1 structure.
- This movement suggests the start of a new uptrend, aligning with a broader Elliott Wave cycle.
- Traders should monitor the wave’s development closely, as it provides insights into future price action.
- The 1.01786 invalidation level is crucial for confirming the validity of the current Elliott Wave count.
- This analysis serves as a valuable guide for understanding the EURUSD market structure and forecasting potential price trends.
Euro/ U.S. Dollar (EURUSD) 4-Hour Chart | Trading Lounge
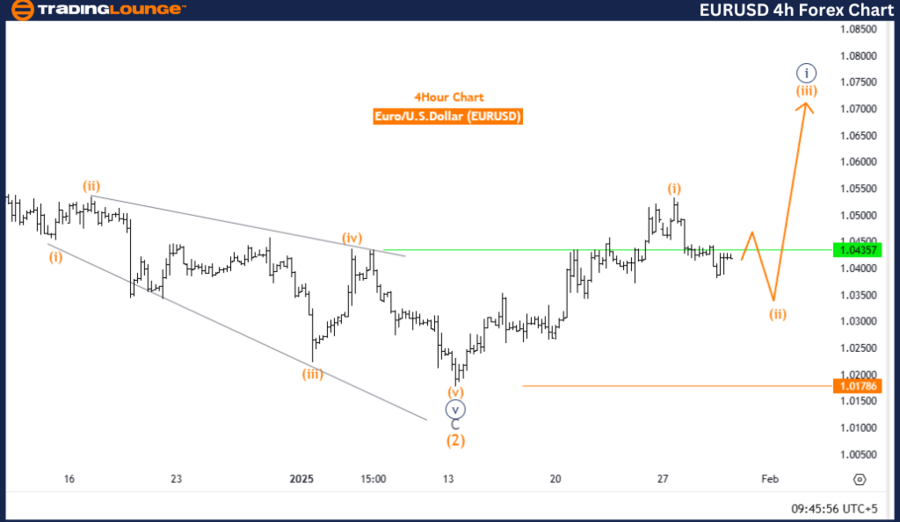
EURUSD Elliott Wave Technical Analysis
Function: Counter-Trend
Mode: Corrective
Structure: Orange Wave 2
Position: Navy Blue Wave 1
Direction Next Higher Degrees: Orange Wave 3
Details: Orange Wave 1 of Navy Blue Wave 1 appears to have completed; Orange Wave 2 is currently developing.
Wave Cancellation Invalid Level: 1.01786
The EURUSD Elliott Wave analysis on the 4-hour chart presents a comprehensive outlook for the Euro/US Dollar currency pair. The market phase is currently classified as a counter-trend movement, suggesting a temporary retracement within the broader bullish trend. The corrective mode indicates that the market is undergoing a pullback or consolidation instead of a continuous upward movement.
This correction is labeled as Orange Wave 2, a sub-wave within the larger Navy Blue Wave 1 structure. It follows Orange Wave 1, which appears to have concluded, leading to the formation of Orange Wave 2 as the market consolidates before the next major move.
The expected next phase in the higher-degree trend is Orange Wave 3, which typically signals a strong upward movement following the corrective phase. Traders should monitor this development closely as it may indicate the resumption of the broader trend.
A wave cancellation invalidation level is placed at 1.01786. If the price moves below this level, the current wave count will become invalid, requiring a reassessment of the Elliott Wave structure.
Summary
- EURUSD is in a corrective phase, identified as Orange Wave 2, forming part of a counter-trend movement within Navy Blue Wave 1.
- Once Orange Wave 2 completes, the market is expected to transition into Orange Wave 3, signaling a potential bullish continuation.
- Traders should monitor the development of Orange Wave 2 and track its completion before positioning for the next move.
- The 1.01786 invalidation level remains a key threshold for confirming the current wave structure.
- This technical analysis offers traders a structured framework for understanding the EURUSD market trend and anticipating future price action.
Technical Analyst: Malik Awais
Source: visit Tradinglounge.com and learn From the Experts Join TradingLounge Here
Previous: USDJPY Elliott Wave Technical Analysis
VALUE Offer - Buy 1 Month & Get 3 Months!Click here
Access 7 Analysts Over 200 Markets Covered. Chat Room With Support