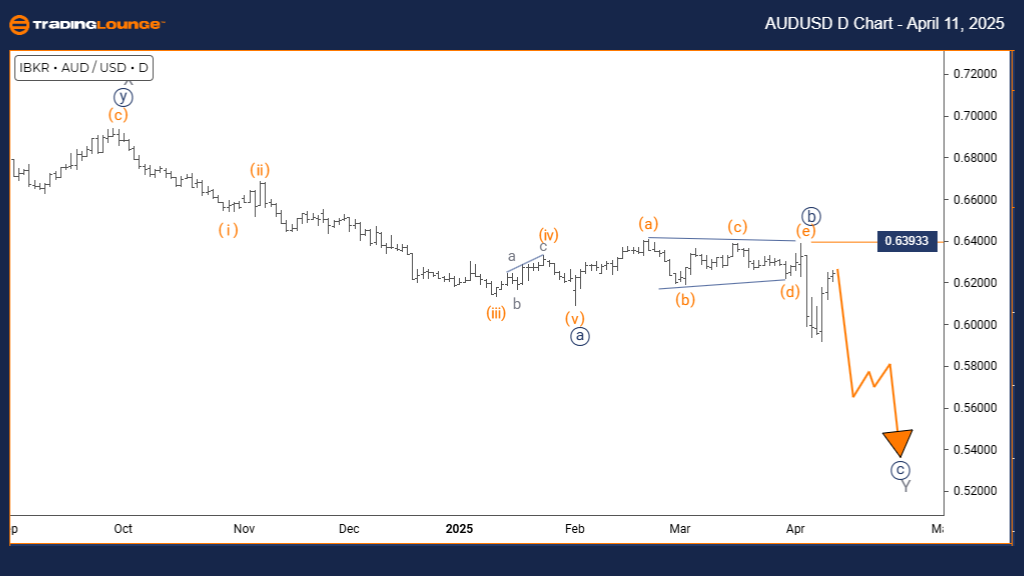
Australian Dollar/U.S. Dollar (AUDUSD) Elliott Wave Analysis – Trading Lounge Daily Chart
AUDUSD Elliott Wave Technical Analysis
Function: Counter Trend
Mode: Impulsive
Structure: Navy blue wave C
Position: Gray wave Y
Direction (Next Lower Degrees): Navy blue wave C (ongoing)
Details: Completion of navy blue wave B signals the beginning of active navy blue wave C.
Invalidation Level: 0.63933
The AUD/USD daily chart is currently showing an impulsive counter-trend phase, as per Elliott Wave theory. The current pattern fits within navy blue wave C, itself part of the broader corrective gray wave Y sequence.
With navy blue wave B likely finished, market activity is now progressing within wave C. This wave is expected to maintain its current direction, suggesting further continuation. Traders should look for confirmation that the impulsive movement is sustained, as such phases are typically strong.
The key level to monitor is 0.63933. A decline below this point would invalidate the present wave count, requiring a reevaluation of the structure.
This Elliott Wave pattern indicates that wave C is active and likely to move forward now that wave B has ended. Traders are advised to track market signals and price momentum, while being aware of the 0.63933 risk threshold.
The Elliott Wave model provides a structured approach to analyzing price action, enabling traders to align strategies with potential trend paths. Focusing on wave development and behavior can help validate this impulsive phase within a corrective framework.
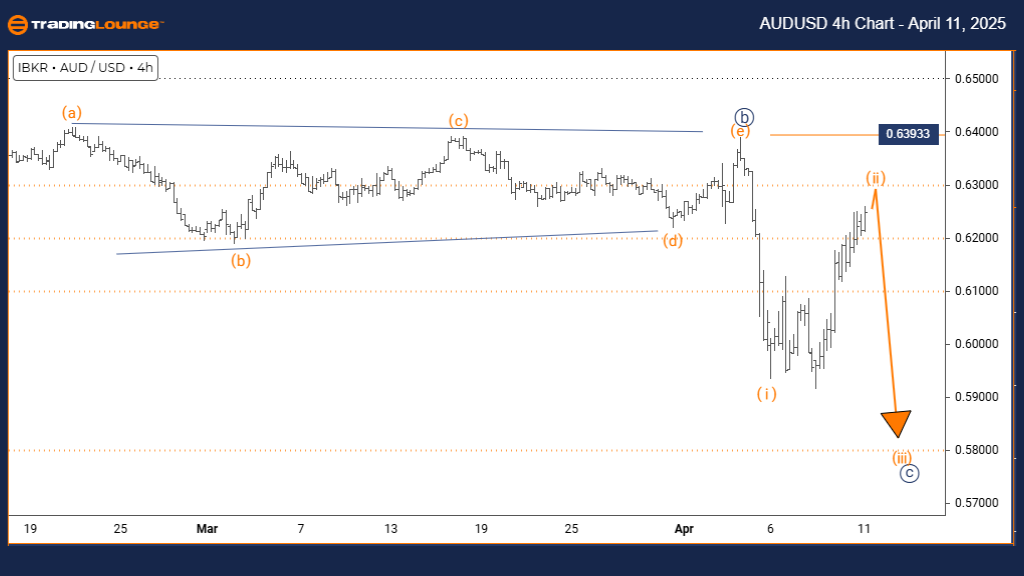
Australian Dollar/U.S. Dollar (AUDUSD) Elliott Wave Analysis – Trading Lounge 4-Hour Chart
AUDUSD Elliott Wave Technical Analysis
Function: Counter Trend
Mode: Corrective
Structure: Orange wave 2
Position: Navy blue wave C
Direction (Next Lower Degrees): Orange wave 3
Details: Orange wave 1 appears complete; orange wave 2 is in progress.
Invalidation Level: 0.63933
The 4-hour chart for AUD/USD highlights a corrective counter-trend phase under Elliott Wave analysis. The current pattern is identified as orange wave 2, within a larger navy blue wave C correction — part of the final phase of a broader three-wave structure.
The previous orange wave 1 seems to have concluded, and the pair is now developing within orange wave 2. A breakout into orange wave 3 is anticipated next, with momentum likely to strengthen in line with the larger trend.
The critical invalidation level is 0.63933. A price drop below this mark would render the current wave count invalid, requiring a fresh market outlook.
This analysis supports a likely bearish continuation once wave 2 ends. Traders should be alert to signs of transition into wave 3, as this wave typically brings strong, trend-aligned moves.
Elliott Wave forecasting allows traders to anticipate potential market directions. Monitoring wave progression and confirmation signals is essential. Validating the end of wave 2 and emergence of wave 3 will be key to aligning strategies with a potential downward move.
Technical Analyst: Malik Awais
Source: Visit Tradinglounge.com and learn from the Experts Join TradingLounge Here
Previous: EURUSD Elliott Wave Technical Analysis
VALUE Offer - Buy 1 Month & Get 3 Months!Click here
Access 7 Analysts Over 200 Markets Covered. Chat Room With Support