12Jul

S&P/TSX 60 Elliott Wave Chart Reveals Bullish Impulse With Strong Wave 3 Setup and Key Support Holding at 1339

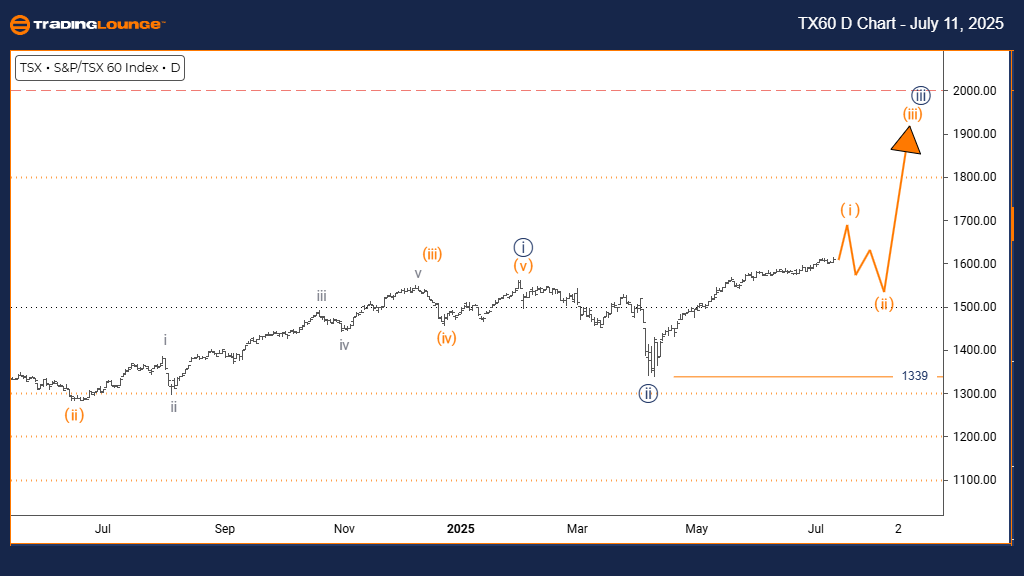
S&P/TSX 60 Elliott Wave Analysis – Trading Lounge Day Chart

S&P/TSX 60 Elliott Wave Technical Analysis

FUNCTION: Bullish Trend

MODE: Impulsive

STRUCTURE: Orange wave 1

POSITION: Navy blue wave 3

DIRECTION NEXT LOWER DEGREES: Orange wave 2

DETAILS: Navy blue wave 2 seems completed; orange wave 1 is now forming within wave 3.

Invalidation Level: 1339

The latest Elliott Wave analysis for the S&P/TSX 60 on the daily chart outlines a bullish market trend reinforced by impulsive wave structure. Currently, orange wave 1 is evolving within navy blue wave 3, indicating a developing upward cycle. The anticipated next move at a lower degree is orange wave 2, expected to be a corrective retracement following the completion of wave 1.

Market analysis confirms the end of navy blue wave 2, with orange wave 1 pushing higher. This progression strengthens the bullish sentiment and sets the stage for continued upward momentum. A price drop below 1339 would negate the current wave count and signal the need for reassessment.

This impulsive pattern signals strong buying interest, with 1339 acting as a key support level. As long as the market holds above this threshold, the bullish Elliott Wave setup remains valid. Traders should focus on identifying the conclusion of orange wave 1 and prepare for orange wave 2’s correction before the likely continuation into wave 3.

TSX60-d-index-chart-...


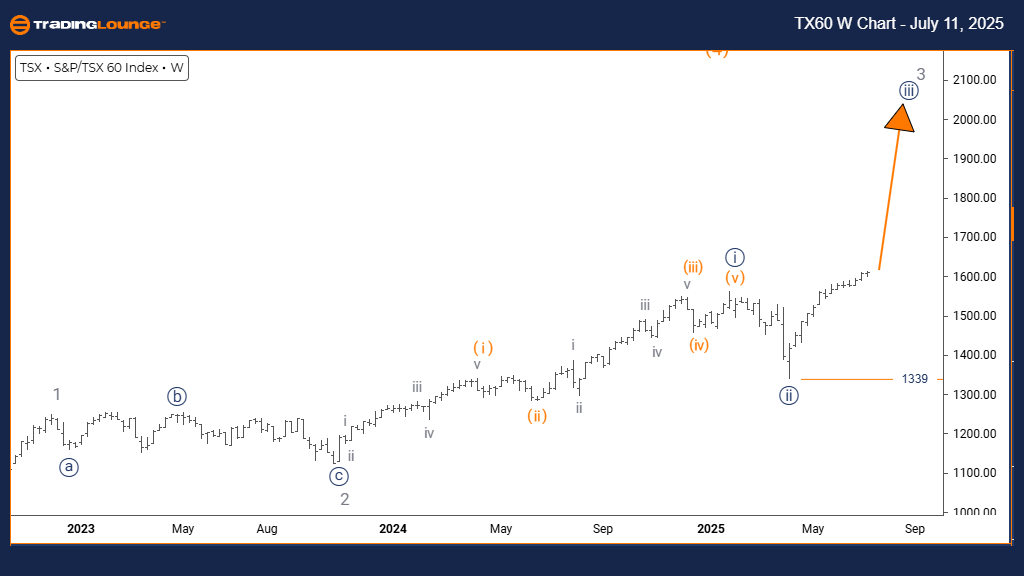
S&P/TSX 60 Elliott Wave Analysis – Trading Lounge Weekly Chart

S&P/TSX 60 Elliott Wave Technical Analysis

FUNCTION: Bullish Trend

MODE: Impulsive

STRUCTURE: Navy blue wave 3

POSITION: Gray wave 3

DIRECTION NEXT LOWER DEGREES: Navy blue wave 4

DETAILS: Navy blue wave 2 has ended; wave 3 of gray wave 3 is in progress.

Invalidation Level: 1339

The weekly Elliott Wave chart of the S&P/TSX 60 index reveals a persistent bullish trend. The structure highlights navy blue wave 3 progressing within a larger gray wave 3, showing impulsive upside movement. The next lower-degree expectation is navy blue wave 4, typically a short corrective stage before the trend resumes.

The analysis suggests navy blue wave 2 has likely concluded, and wave 3 is currently unfolding—indicating increasing upward momentum. If the index falls below 1339, this would invalidate the existing wave count and warrant a technical review.

The impulsive wave behavior continues to reflect robust buying power. Traders should watch for navy blue wave 3’s final stages and the early signs of wave 4. The invalidation mark at 1339 serves as a key benchmark supporting the ongoing bullish outlook.

This technical setup offers insights into potential price developments, helping traders align strategies with the prevailing Elliott Wave structure. Provided the price holds above the invalidation level, the S&P/TSX 60 index is poised for further upside movement.

Technical Analyst: Malik Awais

Source: Visit Tradinglounge.com and learn from the Experts. Join TradingLounge Here

Previous: CAC 40 (France) index Elliott Wave Technical Analysis

VALUE Offer - $1 for 2 Weeks then $29 a month!Click here

Access 7 Analysts Over 200 Markets Covered. Chat Room With Support

TSX60-w-index-chart-...

Related

Soybean Price Analysis: SoyBeans Elliott Wave Technical Analysis, Signals Recovery Amidst Potential Sell-Off

Soybean Price Analysis: SoyBeans Elliott Wave Technical Analysis, Signals Recovery Amidst Potential Sell-Off

Amidst a recent recovery in Soybean prices, Elliott wave analysis reveals a complex picture hinting ...

Read More >
British Pound/Japanese Yen(GBPJPY) Elliottwave Technical analysis - A Comprehensive Overview for Day and 4-Hour Charts

British Pound/Japanese Yen(GBPJPY) Elliottwave Technical analysis - A Comprehensive Overview for Day and 4-Hour Charts

This comprehensive guide offers an in-depth Elliott Wave analysis of the GBPJPY currency pair, provi...

Read More >
USDJPY Elliott Wave Analysis: Bearish Trend Confirmed with Key Levels, Trading Signals & Risk Management Strategies for Forex Traders

USDJPY Elliott Wave Analysis: Bearish Trend Confirmed with Key Levels, Trading Signals & Risk Management Strategies for Forex Traders

This USDJPY Elliott Wave analysis examines the daily and 4-hour chart trends, highlighting an impuls...

Read More >
NIFTY 50 Elliott Wave Technical Analysis for 2025: Corrective Waves, Trend Reversals, Expanded Flat Patterns, and Key Price Levels

NIFTY 50 Elliott Wave Technical Analysis for 2025: Corrective Waves, Trend Reversals, Expanded Flat Patterns, and Key Price Levels

NIFTY 50 index uses Elliott Wave principles to forecast key market movements, including corrective w...

Read More >
S&P 500 Elliott Wave Forecast: Bullish Trend Develops as SPX Forms Wave 1 of 3 After Completing Wave 2 Correction

S&P 500 Elliott Wave Forecast: Bullish Trend Develops as SPX Forms Wave 1 of 3 After Completing Wave 2 Correction

S&P 500 is forming a bullish Elliott Wave impulse pattern. Gray wave 2 is complete and navy blue wav...

Read More >
TATA Consumer Product Stock Elliott Wave analysis - Covers the Future Price Targets and TATACONSUM Technical Chart insights

TATA Consumer Product Stock Elliott Wave analysis - Covers the Future Price Targets and TATACONSUM Technical Chart insights

This article provides an in-depth Elliott Wave analysis of TATA Consumer Product stock (TATACONSUM)....

Read More >

$1 for 2 Weeks

then $29 a month!

What a Special Offer!

Trade Recommendations

Unleash the power of deversified trading with our comprehensive portfolio, covering 250+ markets:

  • Stock Trades
  • Crypto Trades
  • Forex Trades
  • Commodity Trades
Elliott Wave Analysis

Gain a competitive edge with expert insights and AI-powered Elliott Wave charting into:

  • Global Indices
  • US Stocks & ASX Stocks
  • Forex & Crypto
  • Commodities
Top-Notch Trading Tools

Equip yourself with the tools of success:

  • Real-time Chat rooms
  • Elliott Wave Algorithm
  • Portfolio tools
  • TradingLevels
  • Screener
  • Trading Game
7 Elliott Wave Analysts

Stay ahead of the market with daily charts and insightful videos
Your secret to strategic trading!

JOIN HERE


Welcome to TradingLounge (ASIC A.R.No. 321187), specialists in trades, trading education and technical analysis, covering stocks, indices, commodities, forex and cryptocurrencies.

When you join TradingLounge you have access to everything we offer, including trade tools, educational content and a social platform to chat with like-minded investors.

Read more

@Copyright 2024 by tradinglounge.com

Contact Us

Australian no: 02 4787 6020

International no: +61 (2) 47876020

Pay with:

Find us on