10Jul

Bullish CAC 40 Elliott Wave Analysis: Daily Orange Wave 3 & Weekly Navy Blue Wave 1 Confirm Uptrend Above 6771 Support Level

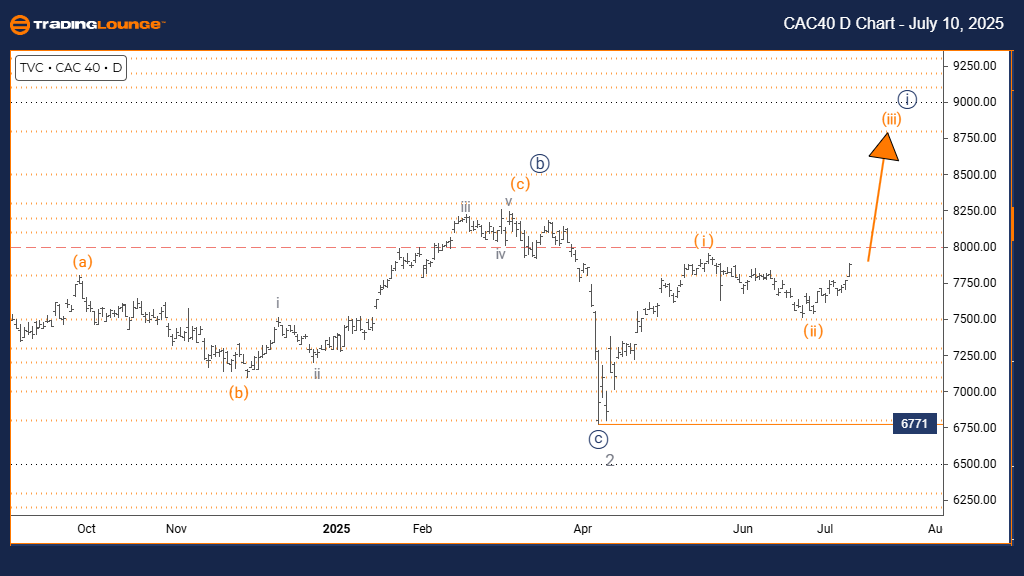
CAC 40 (France) Elliott Wave Analysis - Trading Lounge Daily Chart

CAC 40 (France) Index Daily Chart Analysis

CAC 40 (France) Wave Technical Analysis

Function: Bullish Market Trend

Mode: Impulsive Structure

Structure: Orange Wave 3 Development

Position: Formation of Navy Blue Wave 1

Next Higher Degree Direction: Orange Wave 3 In Progress

Details: Completion of Orange Wave 2 is likely. Orange Wave 3 is currently unfolding.

Wave Invalidation Level: 6771

Daily Chart Overview

The CAC 40 Index on the daily timeframe signals a bullish structure aligned with Elliott Wave theory. The current pattern shows progression into Orange Wave 3—an impulsive wave within the broader Navy Blue Wave 1. This early-phase movement points toward the potential for a longer-term rally in the French stock market.

Momentum indicators suggest Orange Wave 2 has finished, confirming a shift into a bullish phase led by Orange Wave 3. The key invalidation level stands at 6771; any move below this level would question the existing wave setup. Present wave behavior shows increased buying strength and indicates a foundation for a steady upward trend.

This bullish formation offers a favorable trade setup with solid risk-to-reward potential, provided the market holds above critical support. Monitoring wave development is essential for traders aiming to ride the current upward momentum.

CAC40-D-Chart-100725


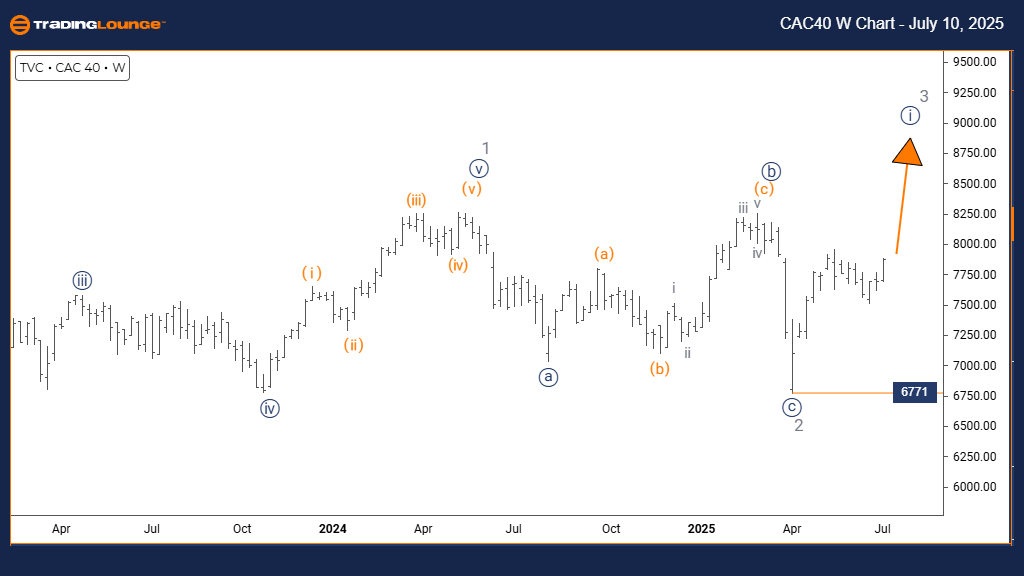
CAC 40 (France) Elliott Wave Analysis - Trading Lounge Weekly Chart

CAC 40 (France) Wave Technical Analysis

Function: Long-Term Trend Direction

Mode: Impulsive Market Behavior

Structure: Navy Blue Wave 1 Initiation

Position: Gray Wave 3 Under Formation

Next Lower Degree Direction: Development of Navy Blue Wave 2

Details: Gray Wave 2 appears to be completed. Navy Blue Wave 1 within Gray Wave 3 is progressing.

Wave Invalidation Level: 6771

Weekly Chart Insight

The weekly view of the CAC 40 Index reflects a solid uptrend supported by Elliott Wave structure. The price is moving through Navy Blue Wave 1, which is part of Gray Wave 3—typically a strong bullish leg. Completion of Gray Wave 2 strengthens the possibility of a sustained impulsive rally.

Wave alignment and bullish momentum support the scenario of continued gains as long as the price remains above 6771. This level serves as a key benchmark for validating the current Elliott Wave count and long-term market outlook.

The weekly chart provides deeper market insight by accounting for institutional trends and broader investor sentiment. Traders should remain alert for potential gains while preparing for corrective price actions, which are typical within Elliott Wave cycles.

Technical Analyst: Malik Awais

Source: Visit Tradinglounge.com and learn from the Experts. Join TradingLounge Here

Previous: NIFTY 50 index Elliott Wave Technical Analysis

VALUE Offer - $1 for 2 Weeks then $29 a month!Click here

Access 7 Analysts Over 200 Markets Covered. Chat Room With Support

CAC40-w-Chart-100725

Related

Australian Dollar / Japanese Yen(AUDJPY) 4 Hour and Day Chart Elliott Wave Technical Analysis 12 October 23

Australian Dollar / Japanese Yen(AUDJPY) 4 Hour and Day Chart Elliott Wave Technical Analysis 12 October 23

In summary, the AUD/JPY Elliott Wave Analysis for 12 October 23, offers insights into the ongoing co...

Read More >
Adani Green Energy - ADANIGREEN Stock Forecast Using Elliott Wave Analysis on Daily and Weekly Charts

Adani Green Energy - ADANIGREEN Stock Forecast Using Elliott Wave Analysis on Daily and Weekly Charts

Elliott Wave analysis of Adani Green stock, highlighting trend direction, forecast patterns, and tra...

Read More >
AMCOR Stock Forecast: ASX AMC Starts Bullish Wave 3 After Corrective Zigzag – Elliott Wave Analysis, Price Targets, Trade Setups

AMCOR Stock Forecast: ASX AMC Starts Bullish Wave 3 After Corrective Zigzag – Elliott Wave Analysis, Price Targets, Trade Setups

AMCOR (ASX: AMC) completes a corrective wave and begins bullish Wave (3). Discover price targets, in...

Read More >
Australian Dollar/U.S.Dollar (AUDUSD) Forex Elliott Wave Technical Analysis: In-depth Trading Lounge Chart Overview

Australian Dollar/U.S.Dollar (AUDUSD) Forex Elliott Wave Technical Analysis: In-depth Trading Lounge Chart Overview

This article provides an in-depth Elliott Wave analysis of the AUDUSD pair, featuring key insights i...

Read More >
Cardano/ U.S. dollar(ADAUSD) Elliott Wave Technical Analysis 7 November 23

Cardano/ U.S. dollar(ADAUSD) Elliott Wave Technical Analysis 7 November 23

ADAUSD Crypto Analysis - Cardano/ U.S. dollar(ADAUSD) Elliott Wave Technical Analysis on 7 November ...

Read More >

$1 for 2 Weeks

then $29 a month!

What a Special Offer!

Trade Recommendations

Unleash the power of deversified trading with our comprehensive portfolio, covering 250+ markets:

  • Stock Trades
  • Crypto Trades
  • Forex Trades
  • Commodity Trades
Elliott Wave Analysis

Gain a competitive edge with expert insights and AI-powered Elliott Wave charting into:

  • Global Indices
  • US Stocks & ASX Stocks
  • Forex & Crypto
  • Commodities
Top-Notch Trading Tools

Equip yourself with the tools of success:

  • Real-time Chat rooms
  • Elliott Wave Algorithm
  • Portfolio tools
  • TradingLevels
  • Screener
  • Trading Game
7 Elliott Wave Analysts

Stay ahead of the market with daily charts and insightful videos
Your secret to strategic trading!

JOIN HERE


Welcome to TradingLounge (ASIC A.R.No. 321187), specialists in trades, trading education and technical analysis, covering stocks, indices, commodities, forex and cryptocurrencies.

When you join TradingLounge you have access to everything we offer, including trade tools, educational content and a social platform to chat with like-minded investors.

Read more

@Copyright 2024 by tradinglounge.com

Contact Us

Australian no: 02 4787 6020

International no: +61 (2) 47876020

Pay with:

Find us on