AUDJPY Elliott Wave Analysis Trading Lounge 4 Hour Chart,26 October 23
Australian Dollar / Japanese Yen(AUDJPY) 4 Hour Chart
AUDJPY Elliott Wave Technical Analysis
Function: Counter Trend
Mode: impulsive
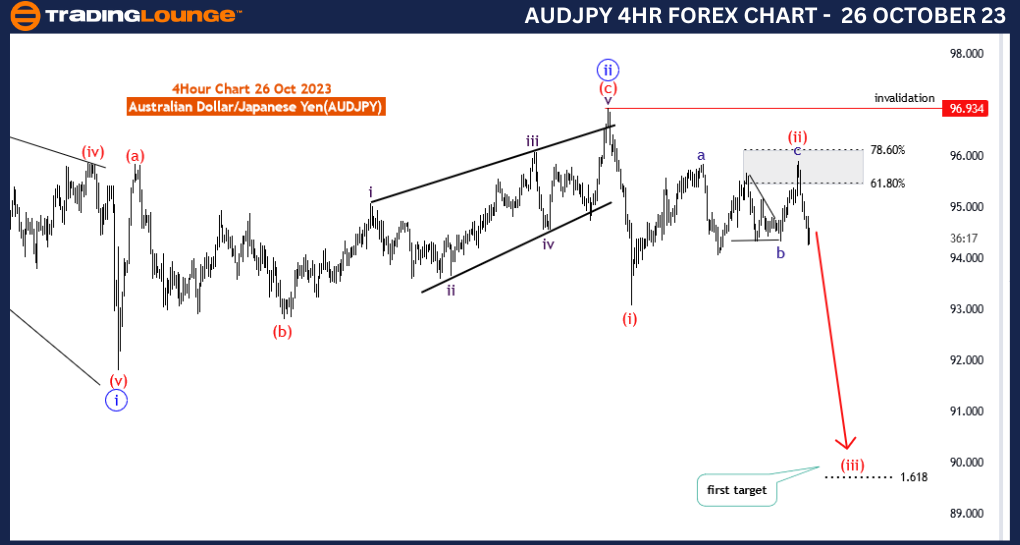
Structure: red wave 3 of blue wave 3
Position: Black wave C
Direction Next lower Degrees: wave (3 of C) started
Details: red wave 2 of 3 completed between fib level 61.80 to 78.60 , Now red wave 3 of blue wave 3 has started . Wave Cancel invalid level:96.934
The AUD/JPY Elliott Wave Analysis for the 4-hour chart on 26 October 23, offers insights into the potential future movements of the Australian Dollar/Japanese Yen (AUD/JPY) currency pair, a critical analysis for traders in the complex world of forex.
This analysis categorizes the function as "Counter Trend," indicating that the current price movement is running counter to the prevailing trend. This suggests the possibility of a reversal or correction in the making, which is a key consideration for traders in this currency pair.
Describing the mode as "impulsive" is crucial, as it suggests that the counter-trend move is strong and significant, hinting at potential notable price changes in the near future. This is a particularly important insight for short- to medium-term traders who are seeking to capitalize on these price movements.
The primary focus of this analysis is on "red wave 3 of blue wave 3," which represents a specific phase within the broader wave pattern. Understanding this wave structure is vital as it provides insights into potential trend reversals or corrections.
The report notes that "red wave 2 of 3 completed between fib level 61.80 to 78.60," and it states that "red wave 3 of blue wave 3 has started." This signifies the end of the corrective phase, which was red wave 2, and the initiation of red wave 3 of blue wave 3. This phase is crucial for traders to monitor as it may present trading opportunities that align with the prevailing trend.
The "Wave Cancel invalid level: 96.934" is a significant reference point. It denotes the price level at which the described wave structure would be invalidated, potentially signaling a shift in market dynamics.
In summary, the AUD/JPY Elliott Wave Analysis for 26 October 23, is invaluable for traders interested in this currency pair. The analysis suggests that the corrective phase has concluded, and a new impulsive wave is in progress. Traders should closely watch the provided invalidation level to manage risks effectively within their trading strategies.
Technical Analyst: Malik Awais
Get Started With TradingLounge Today - tradinglounge.com/Pricing

AUDJPY Elliott Wave Analysis Trading Lounge Day Chart,26 October 23
Australian Dollar / Japanese Yen(AUDJPY) Day Chart
AUDJPY Elliott Wave Technical Analysis
Function: Counter Trend
Mode: impulsive
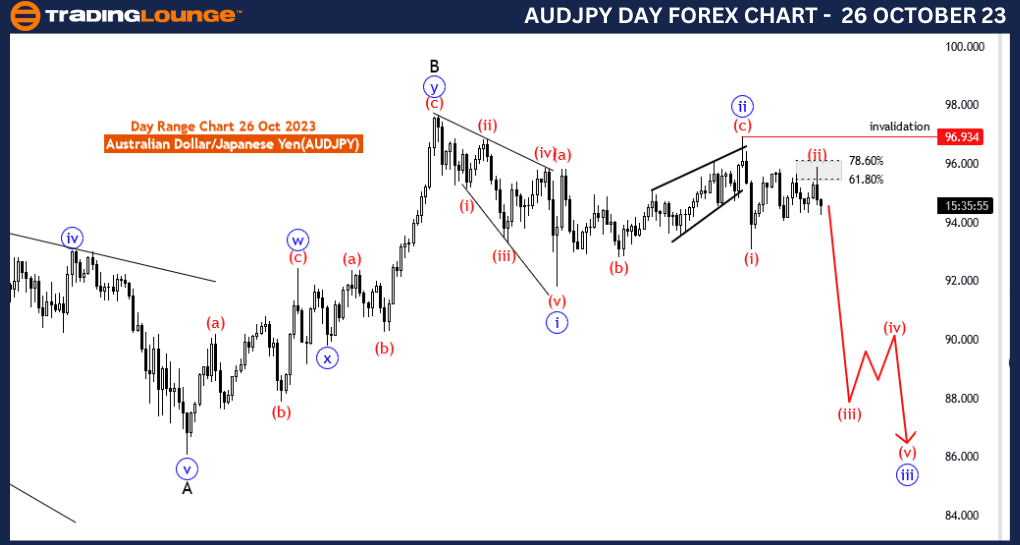
Structure: blue wave 3 of C
Position: Black wave C
Direction Next Higher Degrees: blue wave 4 of C
Details: red wave 2 of 3 completed between fib level 61.80 to 78.60 , Now red wave 3 of blue wave 3 started . Wave Cancel invalid level:96.934
The AUD/JPY Elliott Wave Analysis for the daily chart on 26 October 23, provides critical insights into the potential future movements of the Australian Dollar/Japanese Yen (AUD/JPY) currency pair, offering valuable guidance for forex traders.
The analysis designates the function as "Counter Trend," indicating that the current price movement is acting contrary to the prevailing trend. This suggests that a potential reversal or correction may be in progress. For traders, this is a key point to consider, especially those looking for opportunities to capitalize on price movements that deviate from the main trend.
The analysis identifies the mode as "impulsive," signifying that the counter-trend movement is strong and decisive. This is a significant observation for traders who may be looking for short to medium-term trading opportunities, as such impulsive moves often lead to notable price changes.
The primary focus is on "blue wave 3 of C," which is part of the broader wave pattern. Understanding this wave structure is essential, as it provides insights into potential trend reversals or corrections.
The analysis notes that "red wave 2 of 3 completed between fib level 61.80 to 78.60," and it states that "red wave 3 of blue wave 3 has started." This implies that the correction phase (red wave 2) has concluded, and the currency pair is now entering a new impulsive phase, which is red wave 3 of blue wave 3. This phase is crucial for traders to monitor as it may offer trading opportunities in alignment with the prevailing trend.
The "Wave Cancel invalid level: 96.934" is a significant reference point. It represents the price level at which the described wave structure would be invalidated, potentially indicating a shift in market dynamics.
In summary, the AUD/JPY Elliott Wave Analysis for 26 October 23, provides valuable information for traders. The analysis suggests the end of a corrective phase and the commencement of a new impulsive wave. Traders should closely watch the specified invalidation level to effectively manage risks within their trading strategies.
Technical Analyst: Malik Awais
Get Started With TradingLounge Today - tradinglounge.com/Pricing
