28Nov

Chevron Stock Analysis: Elliott Wave Theory Insights, Daily and 1-Hour Chart Forecasts, CVX Price Targets, and Future Stock Trends

Elliott Wave Analysis: Chevron Inc. (CVX) - Current Trend Insights

This analysis examines Chevron Inc. (CVX) using the Elliott Wave Theory on both the daily and 1-hour charts. Below is a detailed breakdown of the stock’s current position and potential movements based on this methodology.

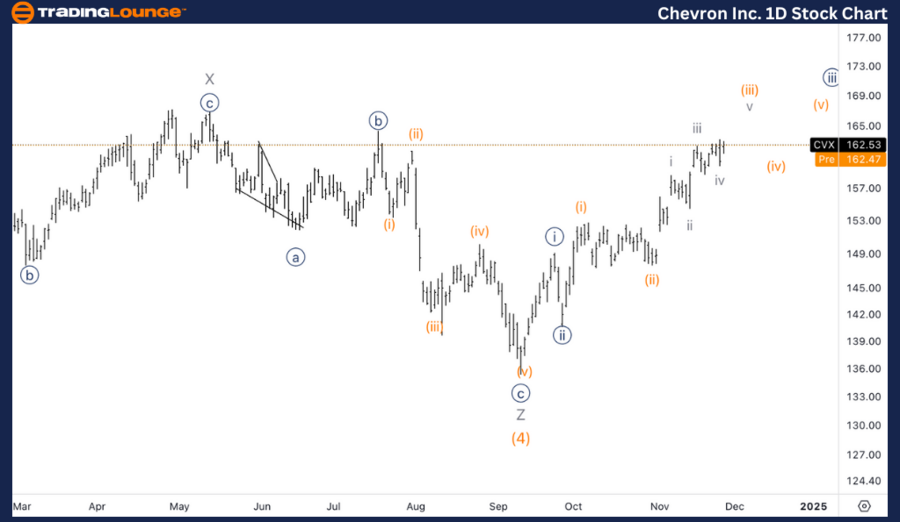
CVX Elliott Wave Analysis: Trading Lounge Daily Chart

Chevron Inc. (CVX) Daily Chart

CVX Elliott Wave Technical Analysis

Function: Trend

Mode: Impulsive

Structure: Motive

Position: Minute {iii}

Direction: Upside within {iii}

Details: The analysis suggests further upside potential into wave {iii}. Currently, we appear to lack the subdivisions of waves (iii) and (iv) within {iii}, which points to a continuation of the upward trend. The wave structure indicates a target near $200, marking the expected completion of wave {iii}.

CVX Elliott Wave Technical Analysis – Daily Chart

Chevron Inc. (CVX) continues to progress within minute wave {iii} of a larger impulsive structure. Missing subdivisions for waves (iii) and (iv) within wave {iii} indicate potential for additional extensions higher. The upward trajectory is forecasted to reach $200, which aligns with the probable completion of wave {iii}.

Chevron-Inc-1D-Stock...


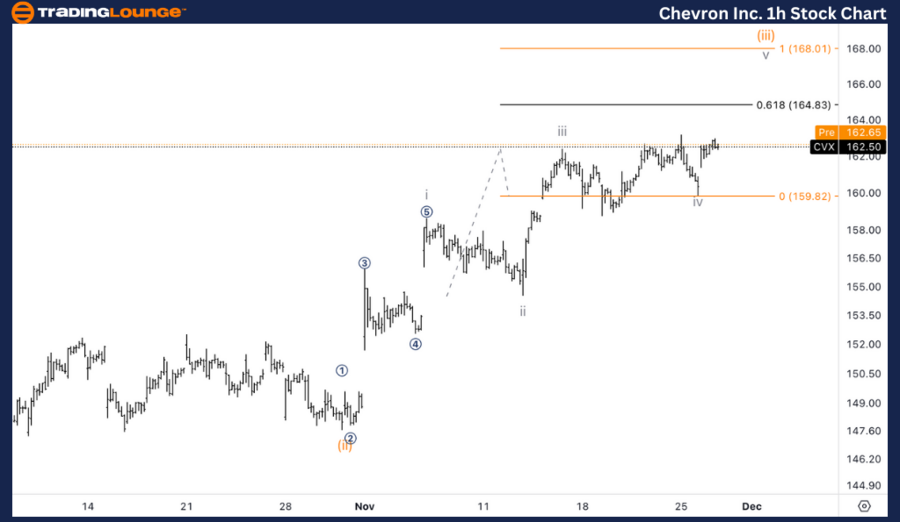
CVX Elliott Wave Analysis: TradingLounge 1-Hour Chart

Chevron Inc. (CVX) 1-Hour Chart

CVX Elliott Wave Technical Analysis

Function: Trend

Mode: Impulsive

Structure: Motive

Position: Wave (iii) of {iii}

Direction: Upside in wave v of (iii)

Details:
Chevron appears to be advancing into wave v of (iii). Since wave iii is shorter than wave i, wave v is expected to be constrained, with a maximum target near $168 based on equality with earlier wave structures.

CVX Elliott Wave Technical Analysis – 1-Hour Chart

On the 1-hour chart, Chevron is moving within wave v of (iii). Given that wave iii is shorter than wave i, wave v must also remain shorter than wave iii. This projection limits the target for wave v to $168, signaling a measured upward progression as wave {iii} nears its completion.

Technical Analyst: Alessio Barretta

Source: visit Tradinglounge.com and learn From the Experts Join TradingLounge Here 

See Previous: Fortinet Inc. (FTNT) Elliott Wave Technical Analysis

VALUE Offer - Buy 1 Month & Get 3 Months!Click here

Access 7 Analysts Over 200 Markets Covered. Chat Room With Support

Chevron-Inc-1h-Stock...

Related

TASI Index Elliott Wave Technical Analysis: Detailed look at current market trends

TASI Index Elliott Wave Technical Analysis: Detailed look at current market trends

This analysis of the TASI Index using Elliott Wave theory provides a detailed look at current market...

Read More >
Unveiling Profit Potential: Chainlink/ U.S. dollar(LINKUSD) Elliott Wave Technical Analysis

Unveiling Profit Potential: Chainlink/ U.S. dollar(LINKUSD) Elliott Wave Technical Analysis

Explore Elliott Wave Analysis for Chainlink/USD (LINKUSD) to unlock profit potential. Discover strat...

Read More >
VeChain / U.S. dollar(VETUSD) Elliott Wave Technical Analysis 26 January 24

VeChain / U.S. dollar(VETUSD) Elliott Wave Technical Analysis 26 January 24

TradingLounge Daily Chart and 4-Hour Chart for VeChain/U.S. dollar Elliott Wave Technical Analysis d...

Read More >
U.S. Dollar / Japanese Yen (USDJPY) Forex Elliott Wave Technical Analysis: Insight to Forecast Potential Market Moves

U.S. Dollar / Japanese Yen (USDJPY) Forex Elliott Wave Technical Analysis: Insight to Forecast Potential Market Moves

This article provides a comprehensive Elliott Wave analysis for USDJPY, covering both the daily and ...

Read More >
IBEX 35 Technical Analysis Using Elliott Wave Shows Bullish Momentum, Investment Outlook, and Trading Strategy Insights

IBEX 35 Technical Analysis Using Elliott Wave Shows Bullish Momentum, Investment Outlook, and Trading Strategy Insights

Elliott Wave analysis of the IBEX 35 index, highlighting its current bullish trend. Learn about wave...

Read More >
USDCHF Elliott Wave Analysis: Bullish Trends, Wave Counts, Chart Insights, and Key Invalidation Levels Explained

USDCHF Elliott Wave Analysis: Bullish Trends, Wave Counts, Chart Insights, and Key Invalidation Levels Explained

The USDCHF Elliott Wave analysis indicates a bullish trend supported by impulsive wave structures on...

Read More >

Buy 1 Month

Get 3 Months!

Special Offer:

Trade Recommendations

Unleash the power of deversified trading with our comprehensive portfolio, covering:

  • Stock Trades
  • Crypto Trades
  • Forex Trades
  • Commodity Trades
Elliott Wave Analysis

Gain a competive edge with expert insights in to:

  • Global Indices
  • US Stocks & ASX Stocks
  • Forex & Crypto
  • Commodities
Top-Notch Trading Tools

Equip yourself with the tools of success:

  • Social Chat
  • Elliott Wave Algorithm
  • Screener
  • TradingLevels
  • Trading Game
7 Elliott Wave Analysts

Stay ahead of the market with daily charts and insightful videos
-Your secret to strategic trading!

JOIN HERE


Welcome to TradingLounge (ASIC A.R.No. 321187), specialists in trades, trading education and technical analysis, covering stocks, indices, commodities, forex and cryptocurrencies.

When you join TradingLounge you have access to everything we offer, including trade tools, educational content and a social platform to chat with like-minded investors.

Read more

@Copyright 2024 by tradinglounge.com

Contact Us

Australian no: 02 4787 6020

International no: +61 (2) 47876020

Pay with:

Find us on