26Nov

Fortinet Inc. (FTNT) Stocks Elliott Wave Technical Analysis: Examines its Daily and 1-Hour Charts to Provide Insights into Current Wave Positions and Price Targets

FTNT Elliott Wave Analysis: Assessing Fortinet Inc.’s Trend Structure

In this Elliott Wave analysis, we evaluate the trend structure of Fortinet Inc. (FTNT) using daily and 1-hour charts to pinpoint the current wave position and potential price movements.

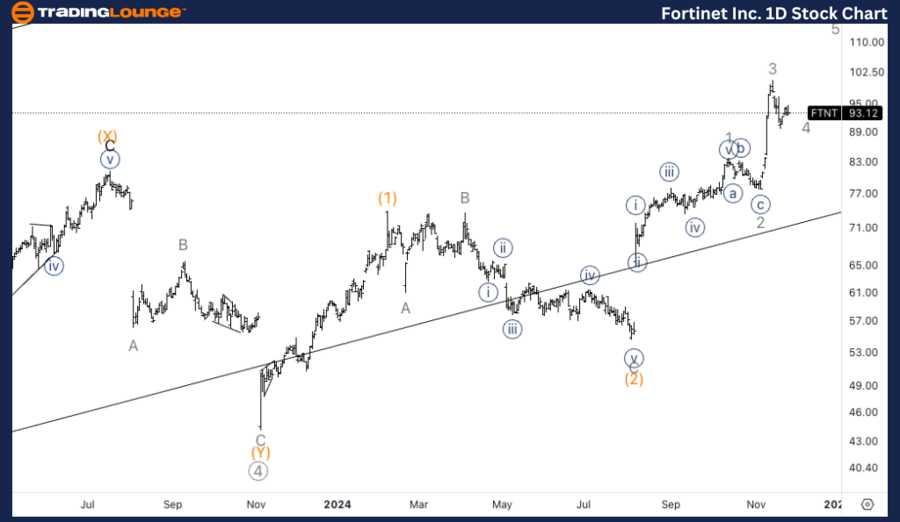
Fortinet Inc. (FTNT) Elliott Wave Analysis and Daily Chart Analysis

FTNT Elliott Wave Technical Analysis

Function: Trend

Mode: Impulsive

Structure: Motive

Position: Wave (3)

Direction: Upside within wave (3)

Details: Fortinet is advancing in Intermediate wave (3), with the price surpassing TradingLevel1 at $100. The equality of wave (3) compared to wave (1) was achieved at $91. The next target is the 1.618 extension of wave (1), projected at $125, highlighting further upside potential as the wave unfolds.

FTNT Elliott Wave Analysis: Daily Chart Highlights

Fortinet Inc. (FTNT) is currently in Intermediate wave (3), characterized by a strong impulsive trend. The stock recently crossed TradingLevel1 at $100, and wave (3) has already equaled the length of wave (1) at $91. The focus now shifts to the 1.618 Fibonacci extension, suggesting a target of $125. This indicates that Fortinet could experience additional gains as this wave progresses.

Fortinet-Inc-1D-Stoc...


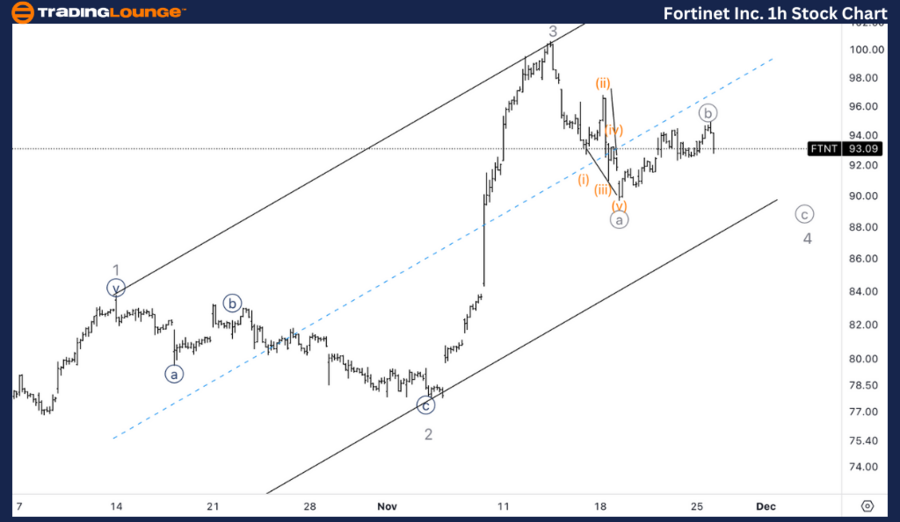
Fortinet Inc. (FTNT) 1-Hour Chart Analysis

FTNT Elliott Wave Technical Analysis

Function: Trend

Mode: Impulsive

Structure: Motive

Position: Wave 4 of (3)

Direction: Bottom in wave 4

Details: The 1-hour chart shows Fortinet correcting in wave 4 of (3), following the recent rally. A leading diagonal appears to have formed in wave {a} of 4, indicating that the correction phase may be near completion. An alternate count suggests that the structure could represent wave {ii} of 3, which would imply a stronger upside if confirmed. Traders should watch for a wave 4 bottom, as this could set the stage for a continuation of the upward trend.

FTNT Elliott Wave Analysis: 1-Hour Chart Highlights

The short-term wave structure in Fortinet (FTNT) indicates wave 4 of (3) correction is in progress. The formation of a leading diagonal in wave {a} of 4 supports the expectation of a near-term bounce. Alternatively, if the current structure is wave {ii} of 3, it implies a steeper bullish trajectory. Either scenario points to a continuation of the uptrend once the correction concludes.

Technical Analyst: Alessio Barretta

Source: visit Tradinglounge.com and learn From the Experts Join TradingLounge Here 

See Previous: Tesla Inc Elliott Wave Technical Analysis

VALUE Offer - Buy 1 Month & Get 3 Months!Click here

Access 7 Analysts Over 200 Markets Covered. Chat Room With Support

Fortinet-Inc-1h-Stoc...

Related

Soybean Elliott Wave Analysis: Impulsive Trend Structure Points to Bearish Correction

Soybean Elliott Wave Analysis: Impulsive Trend Structure Points to Bearish Correction

Since the peak of tensions between Russia and Ukraine in 2022, Soybean prices have depicted a downtr...

Read More >
ASX: WESTPAC BANKING CORPORATION Elliott Wave Analysis – WBC Stock Forecast, Fibonacci Targets & ASX Market Trends

ASX: WESTPAC BANKING CORPORATION Elliott Wave Analysis – WBC Stock Forecast, Fibonacci Targets & ASX Market Trends

Westpac Banking Corporation (ASX: WBC) analysis provides insights into current market trends, share ...

Read More >
Super Micro Computers Inc. (SMCI) Stocks Elliott Wave Technical Analysis: Stock Chart Trends, and Possible Breakouts

Super Micro Computers Inc. (SMCI) Stocks Elliott Wave Technical Analysis: Stock Chart Trends, and Possible Breakouts

This article provides a comprehensive Elliott Wave analysis of SuperMicro Computers Inc. (SMCI). It ...

Read More >
Wheat Commodity Elliott Wave Technical Analysis: Key Market Movements and Predictions for Wheat Prices

Wheat Commodity Elliott Wave Technical Analysis: Key Market Movements and Predictions for Wheat Prices

This article delves into the Wheat Elliott Wave Analysis, providing insights into price forecasts an...

Read More >
Nvidia Corporation (NVDA) Stock Analysis: NVDA Elliott Wave Forecast, Technical Outlook, and Trend Reversal Insights

Nvidia Corporation (NVDA) Stock Analysis: NVDA Elliott Wave Forecast, Technical Outlook, and Trend Reversal Insights

Elliott Wave analysis of NVIDIA Corp. (NVDA), highlighting corrective patterns on the daily and 1-ho...

Read More >

Buy 1 Month

Get 3 Months!

Special Offer:

Trade Recommendations

Unleash the power of deversified trading with our comprehensive portfolio, covering:

  • Stock Trades
  • Crypto Trades
  • Forex Trades
  • Commodity Trades
Elliott Wave Analysis

Gain a competive edge with expert insights in to:

  • Global Indices
  • US Stocks & ASX Stocks
  • Forex & Crypto
  • Commodities
Top-Notch Trading Tools

Equip yourself with the tools of success:

  • Social Chat
  • Elliott Wave Algorithm
  • Screener
  • TradingLevels
  • Trading Game
7 Elliott Wave Analysts

Stay ahead of the market with daily charts and insightful videos
-Your secret to strategic trading!

JOIN HERE


Welcome to TradingLounge (ASIC A.R.No. 321187), specialists in trades, trading education and technical analysis, covering stocks, indices, commodities, forex and cryptocurrencies.

When you join TradingLounge you have access to everything we offer, including trade tools, educational content and a social platform to chat with like-minded investors.

Read more

@Copyright 2024 by tradinglounge.com

Contact Us

Australian no: 02 4787 6020

International no: +61 (2) 47876020

Pay with:

Find us on