ASX: CSL LIMITED – Elliott Wave Technical Analysis (1D Chart)
Greetings! In this Elliott Wave analysis, we update the technical outlook for CSL Limited (ASX: CSL) on the Australian Stock Exchange (ASX). The current pattern suggests that CSL may be advancing within wave ((iii))-navy.
ASX: CSL LIMITED Elliott Wave Technical Analysis
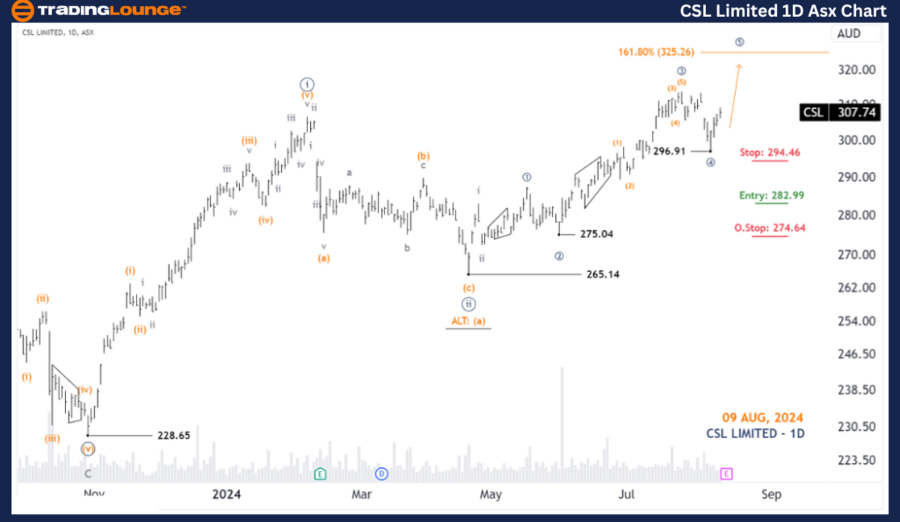
ASX: CSL LIMITED – 1D Chart (Semilog Scale) Analysis
Function: Major Trend (Minute Degree, Navy)
Mode: Motive
Structure: Impulse
Position: Wave ((5))-navy of Wave iii-grey of Wave ((iii))-navy
Details: Wave ((4))-navy has recently concluded, and Wave ((5))-navy is now unfolding, suggesting a continued upward movement. The prior long trade remains strong and effective.
Invalidation Point: 296.91

ASX: CSL LIMITED – Elliott Wave Technical Analysis (4-Hour Chart)
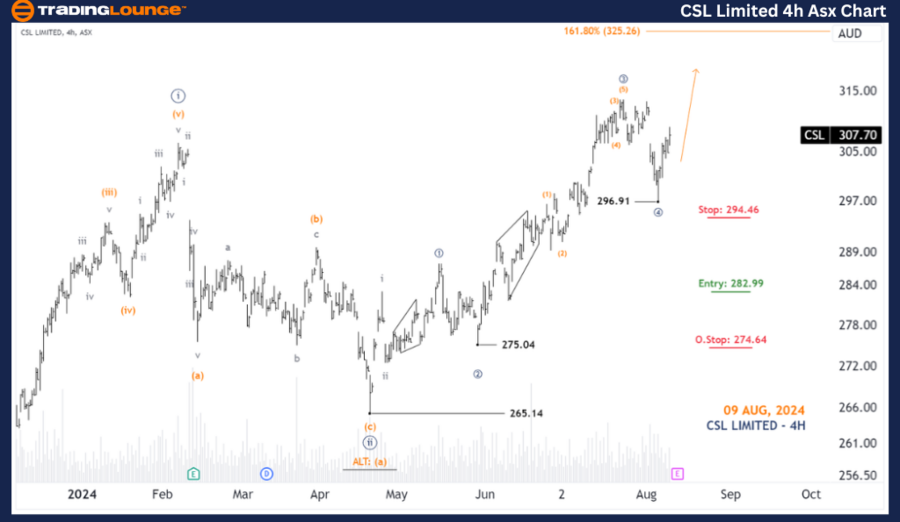
ASX: CSL LIMITED – 4-Hour Chart Analysis
Function: Major Trend (Minuette Degree, Orange)
Mode: Motive
Structure: Impulse
Position: Wave ((5))-navy of Wave iii-gray of Wave ((iii))-navy
Details: Similar to the daily chart, Wave ((4))-navy has completed, and Wave ((5))-navy is progressing, likely driving the price towards the target range of 320.00 - 325.26. The price must stay above 296.91 to sustain this bullish outlook.
Invalidation Point: 296.91
Conclusion
Our analysis of CSL Limited (ASX: CSL) focuses on providing insights into current market trends, helping traders make informed decisions. We offer key price points that validate or invalidate our wave count, enhancing confidence in our forecast. This approach aims to deliver an objective and professional view of market movements.
Technical Analyst: Hua (Shane) Cuong, CEWA-M (Master’s Designation).
Source: visit Tradinglounge.com and learn From the Experts Join TradingLounge Here
Previous: ASX LIMITED Elliott Wave Technical Analysis
Special Trial Offer - 0.76 Cents a Day for 3 Months! Click here
Access 7 Analysts Over 170 Markets Covered. Chat Room With Support
