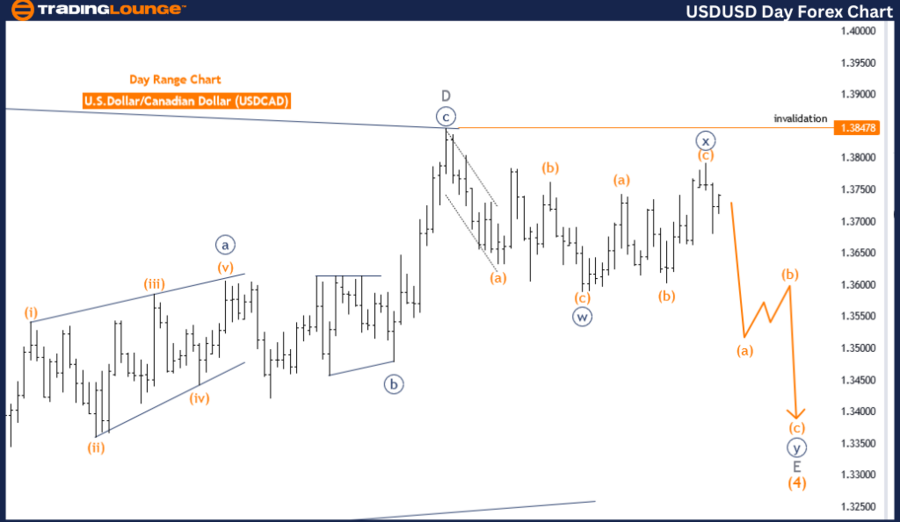
USDCAD Elliott Wave Analysis Trading Lounge Day Chart
U.S. Dollar / Canadian Dollar Currency Pair Analysis
USD/CAD Elliott Wave Technical Analysis
FUNCTION: Counter Trend
MODE: Impulsive
STRUCTURE: Orange wave A
POSITION: Navy blue wave Y
DIRECTION NEXT HIGHER DEGREES: Orange wave B
DETAILS: Navy blue wave X looks completed, now orange wave A of Y is in play.
Wave Cancel invalid level: 1.38478
The USD/CAD Elliott Wave analysis on the daily chart focuses on a counter-trend movement exhibiting an impulsive mode. The current wave structure is identified as orange wave A, situated within the broader pattern of navy blue wave Y. This suggests that the market is in the early stages of a corrective phase following the completion of navy blue wave X.
The primary function of this analysis is to track counter-trend movements within the USD/CAD market. The impulsive nature of the current mode indicates that orange wave A is actively progressing within the corrective sequence. The wave structure, marked as orange wave A, signifies the initiation of a downward movement within the corrective phase.
The position of navy blue wave Y suggests that the market has transitioned into a new phase of correction. The direction for the next higher degrees is identified as orange wave B, indicating that after the completion of orange wave A, the market will enter the corrective phase of orange wave B.
Details within the analysis highlight that navy blue wave X is likely completed, and the market is now experiencing orange wave A of navy blue wave Y. This signifies the beginning of a new leg in the downward corrective sequence. Upon the completion of orange wave A, the market is expected to move into the corrective phase of orange wave B.
A critical component of this analysis is the wave cancel invalid level, set at 1.38478. This level is crucial for maintaining the validity of the current wave count. If the market price surpasses this level, the existing wave structure would be invalidated, necessitating a reassessment of the Elliott Wave analysis and potentially altering the anticipated market direction.
In summary, the USD/CAD daily chart analysis indicates that the market is in the early stages of a new corrective phase within navy blue wave Y. The ongoing orange wave A suggests a downward movement, which will transition into orange wave B upon its completion. The wave cancel invalid level at 1.38478 is essential for confirming the current wave count and guiding future market expectations based on the Elliott Wave principles.
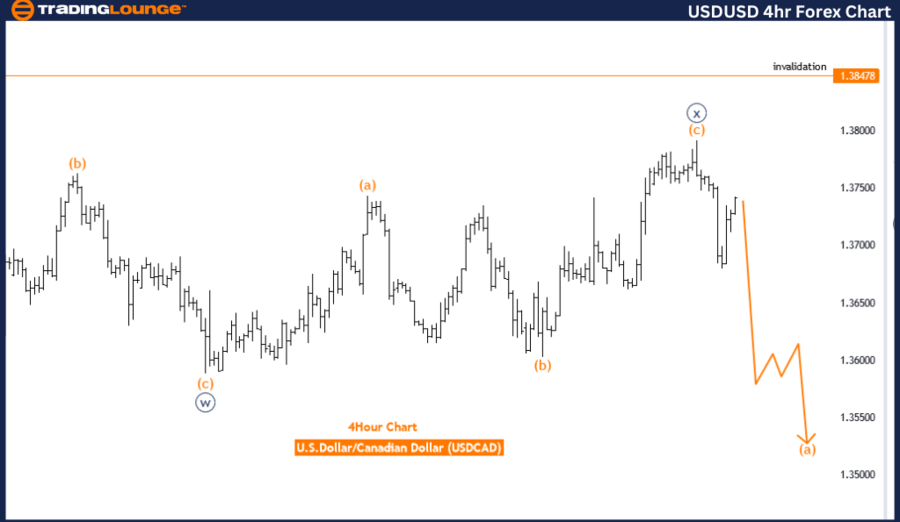
USDCAD Elliott Wave Analysis Trading Lounge 4-Hour Chart
U.S. Dollar / Canadian Dollar (USD/CAD) Chart Analysis
USD/CAD Elliott Wave Technical Analysis
FUNCTION: Counter Trend
MODE: Impulsive
STRUCTURE: Orange wave A
POSITION: Navy blue wave Y
DIRECTION NEXT HIGHER DEGREES: Orange wave B
DETAILS: Navy blue wave X looks completed, now orange wave A of Y is in play.
Wave Cancel invalid level: 1.38478
The USD/CAD Elliott Wave analysis on the four-hour chart examines a counter-trend movement in an impulsive mode. The current wave structure is identified as orange wave A, and the position is noted as navy blue wave Y. This suggests that the market is experiencing the early stages of a new wave sequence within a broader corrective pattern.
The primary function of this analysis is to track counter-trend movements in the USD/CAD market. The wave mode is impulsive, indicating that orange wave A is an active and dynamic part of the corrective phase. The wave structure, marked as orange wave A, signifies the beginning of a downward corrective movement.
The position of navy blue wave Y indicates that the market has entered a new phase within the corrective pattern. The direction for the next higher degrees is identified as orange wave B, suggesting that after the completion of orange wave A, the market will move into the corrective phase of orange wave B.
Details in the analysis indicate that navy blue wave X has likely completed, and now orange wave A of navy blue wave Y is currently in play. This means that the market is undergoing the initial leg of the new corrective sequence. Once orange wave A concludes, the next phase will involve the corrective movement of orange wave B.
A critical aspect of this analysis is the wave cancel invalid level, set at 1.38478. This level is vital for maintaining the integrity of the current wave structure. If the market price rises above this level, it would invalidate the existing wave count, requiring a reassessment of the Elliott Wave analysis and possibly altering the anticipated market direction.
In summary, the USD/CAD four-hour chart analysis reveals that the market is in the early stages of a new corrective phase within navy blue wave Y. The ongoing orange wave A suggests a downward movement, which will transition into orange wave B upon completion. The wave cancel invalid level at 1.38478 is crucial for validating the current wave count and guiding future market expectations based on the Elliott Wave principles.
Technical Analyst: Malik Awais
Source: visit Tradinglounge.com and learn From the Experts Join TradingLounge Here
Previous: EURUSD Elliott Wave Technical Analysis
Special Trial Offer - 0.76 Cents a Day for 3 Months! Click here
Access 7 Analysts Over 170 Markets Covered. Chat Room With Support