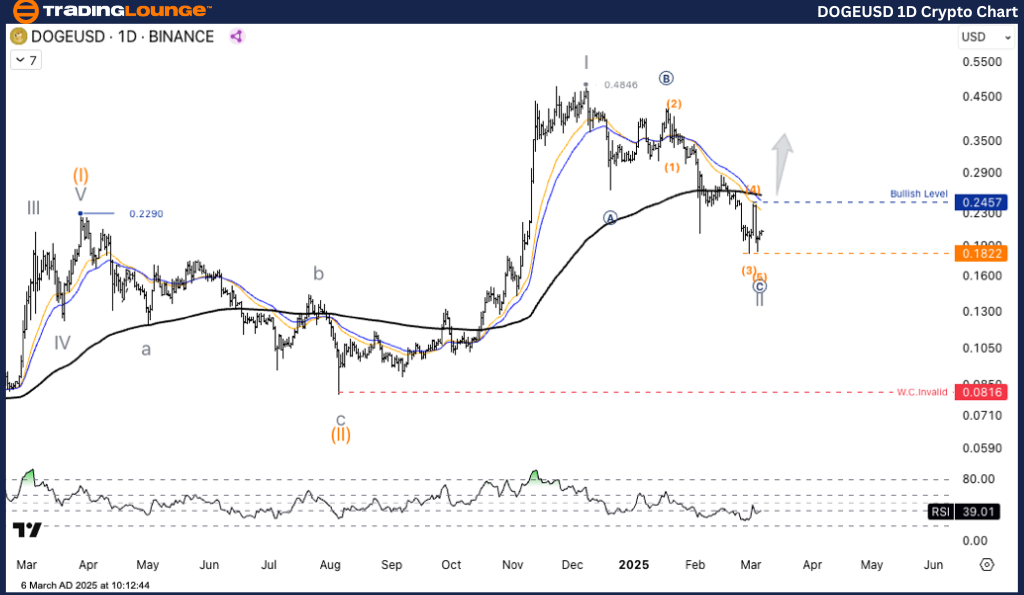
Dogecoin/ U.S. Dollar (DOGEUSD) Elliott Wave Analysis - TradingLounge Daily Chart
DOGEUSD Elliott Wave Technical Analysis
Function: Counter Trend
Mode: Corrective
Structure: Flat
Position: Wave C
Next Higher Degree Direction: Wave (III) of Impulse
Wave Cancellation Invalid Level: N/A
Details: The ongoing Wave C correction is unfolding before the price resumes its anticipated uptrend. Traders should wait for a clear reversal signal before making a move.
Dogecoin/ U.S. Dollar (DOGEUSD) Trading Strategy
Dogecoin (DOGE) is currently in a pivotal phase. Based on Elliott Wave Theory, the price is approaching the final stages of Wave (II) after an extended correction, potentially offering new trading opportunities.
Key Levels to Watch
Trading Strategy
📌 Long Strategy:
- ✅ Pullback Entry: Consider buying when the price approaches the key support level.
- If the price holds above 0.1822 and bounces back, traders may look for long entry opportunities.
Risk Management
- If the price falls below 0.1822, traders should hold off and wait for a stronger reversal signal before entering a position.
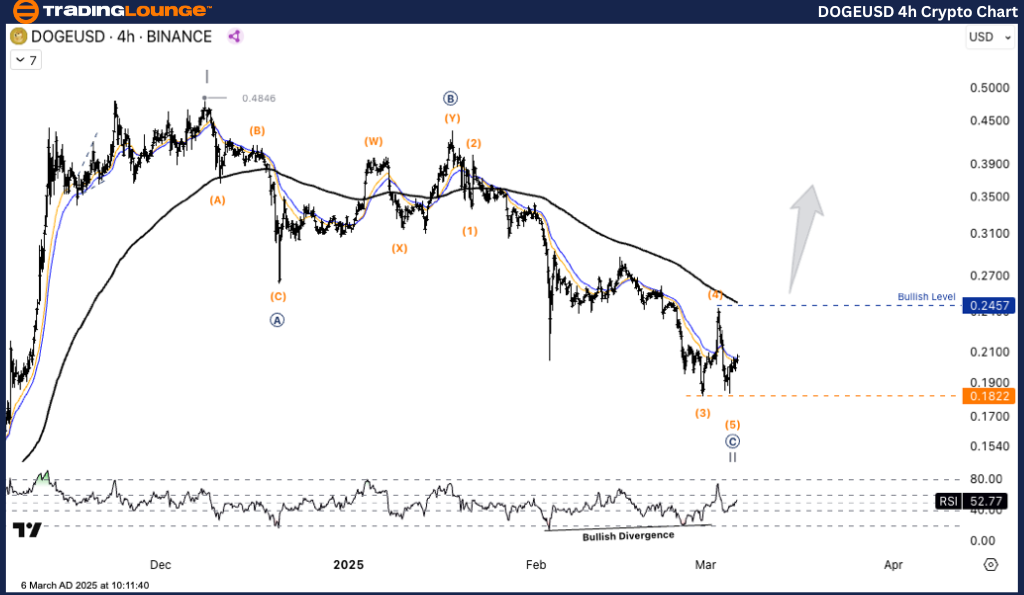
Dogecoin/ U.S. Dollar (DOGEUSD) Elliott Wave Analysis - TradingLounge H4 Chart
DOGEUSD Elliott Wave Technical Analysis
Function: Counter Trend
Mode: Corrective
Structure: Flat
Position: Wave C
Next Higher Degree Direction: Wave (III) of Impulse
Wave Cancellation Invalid Level: N/A
Details: The Wave C correction remains active before a potential trend reversal. Traders should be on alert for confirmation signals.
Dogecoin/ U.S. Dollar (DOGEUSD) Trading Strategy
Dogecoin (DOGE) is in a critical zone. Following a prolonged correction, the price is now approaching the end of Wave (II) under Elliott Wave Theory, signaling possible new trading opportunities.
Key Levels to Monitor
- 0.1822 - Key Support Level: A break below this level could suggest further downside.
- 0.2457 - Key Resistance Level: If the price breaks this level, it may confirm the beginning of an uptrend.
- 0.4846 - Long-Term Target: If the uptrend gains momentum, this could serve as a long-term price objective.
Trading Strategy
📌 Long Strategy:
- ✅ Pullback Entry: Consider buying when the price moves near the critical support level.
- If the price remains above 0.1822 and rebounds, traders might look for long positions.
Risk Management
- If the price drops below 0.1822, it's recommended to wait for a clear reversal signal before initiating trades.
Technical Analyst: Kittiampon Somboonsod
Source: visit Tradinglounge.com and learn From the Experts Join TradingLounge Here
Previous: ADAUSD Elliott Wave Technical Analysis
VALUE Offer - Buy 1 Month & Get 3 Months!Click here
Access 7 Analysts Over 200 Markets Covered. Chat Room With Support