06Mar

Stock Analysis: The Coca-Cola Company (KO) Elliott Wave Technical Analysis provides valuable insights

KO Elliott Wave Analysis Trading Lounge Daily Chart, 6 March 24

Welcome to our KO Elliott Wave Analysis Trading Lounge, your go-to destination for in-depth insights into The Coca-Cola Company (KO) using Elliott Wave Technical Analysis. Let's delve into the market dynamics as of the Daily Chart on 6 March 24

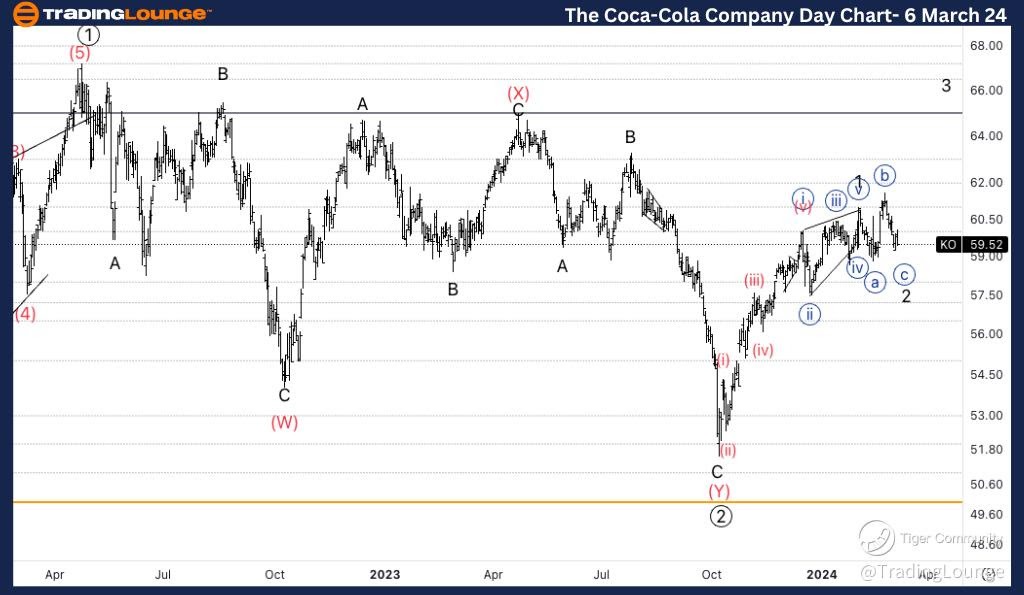
The Coca-Cola Company, (KO) Daily Chart Analysis

KO Elliott Wave Technical Analysis

FUNCTION: Trend

MODE: Motive  

STRUCTURE: Impulsive

POSITION: Minor wave 2 of (3).  

DIRECTION: Completion of wave {c} of 2.    

DETAILS: Looking for support to be found on top of 60$, as we seem to have resumed from the 50$ low impulsively and we have yet to confirm th count, breaking previous wave (X) at Medium Level 65$.

KO Elliott Wave Technical Analysis – Daily Chart*

Our analysis reveals a trend function with a motive mode, characterized by an impulsive structure. Positioned in Minor wave 2 of (3), we anticipate the completion of wave {c} of 2. Our focus lies on finding support above $60, following the resumption from the $50 low in an impulsive manner. Confirmation of this count entails breaking the previous wave (X) at Medium Level $65.

The-Coca-Cola-Day-st...


KO Elliott Wave Analysis Trading Lounge 4Hr Chart, 6 March 24

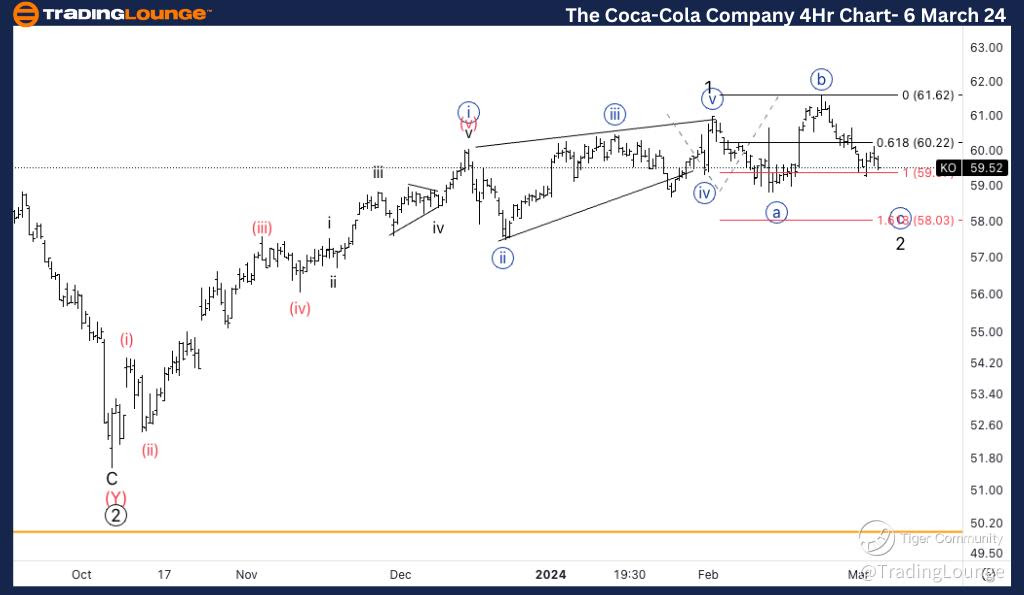
The Coca-Cola Company, (KO) 4Hr Chart Analysis

Elliott Wave Technical Analysis for KO

FUNCTION: Counter Trend  

MODE: Corrective

STRUCTURE: Flat  

POSITION: Wave {c} of 2.  

DIRECTION: Completion of wave {c} of 2.  

DETAILS: Looking for a bottom in wave {c}, we have hit equality of {c} vs. {a} at 59.5$, looking to reach the demand zone at 58$ to then expect a turn higher.

KO Elliott Wave Technical Analysis – 4Hr Chart

Here, we identify a counter-trend function with a corrective mode, marked by a flat structure. Positioned in Wave {c} of 2, we anticipate the completion of Wave {c} of 2. Our attention is directed towards identifying a bottom in wave {c}, with equality observed between {c} and {a} at $59.5. We anticipate reaching the demand zone at $58, followed by an upward reversal.

Technical Analyst: Alessio Barretta

Source: visit Tradinglounge.com and learn From the Experts Join TradingLounge Here 

See Previous: Apple Inc., (AAPL)

TradingLounge Once Off SPECIAL DEAL: Here > 1 month Get 3 months.   

The-Coca-Cola-4Hr-st...

Related

KOSPI Composite Index Elliott Wave Technical Analysis: Understanding market behaviour and effective trading strategies

KOSPI Composite Index Elliott Wave Technical Analysis: Understanding market behaviour and effective trading strategies

The KOSPI Composite analysis provides insights using Elliott Wave Theory, detailing both day and wee...

Read More >
V300AEQ ETF UNITS – VAS Stock Analysis & Vanguard Elliott Wave Technical Forecast

V300AEQ ETF UNITS – VAS Stock Analysis & Vanguard Elliott Wave Technical Forecast

Our latest Elliott Wave analysis on ASX: V300AEQ ETF Units – VAS reveals that wave 2-red has conclu...

Read More >
Elliott Wave Analysis: How CPI Figures Impact S&P 500, NASDAQ, DAX 40, and More

Elliott Wave Analysis: How CPI Figures Impact S&P 500, NASDAQ, DAX 40, and More

The latest Elliott Wave Analysis indicates a market response to rising CPI figures, leading to a dow...

Read More >
Dell Technologies Inc. Stock: Detailed DELL Elliott Wave Technical Analysis and Future Market Trends

Dell Technologies Inc. Stock: Detailed DELL Elliott Wave Technical Analysis and Future Market Trends

This comprehensive Elliott Wave analysis for Dell Technologies (DELL) provides a detailed breakdown ...

Read More >
Binance Crypto Price News Today Elliott Wave Technical Analysis: BNBUSD comprehensive look at the current and future market trends

Binance Crypto Price News Today Elliott Wave Technical Analysis: BNBUSD comprehensive look at the current and future market trends

This detailed Elliott Wave analysis of BNBUSD provides a comprehensive look at the current and futur...

Read More >
U.S.Dollar/Swiss Franc Analysis covers Forex chart forecasts: USDCHF Elliott Wave Technical Analysis

U.S.Dollar/Swiss Franc Analysis covers Forex chart forecasts: USDCHF Elliott Wave Technical Analysis

Get the latest USDCHF Elliott Wave analysis for accurate forex trading strategies. This analysis cov...

Read More >

$1 for 2 Weeks

then $29 a month!

What a Special Offer!

Trade Recommendations

Unleash the power of deversified trading with our comprehensive portfolio, covering 250+ markets:

  • Stock Trades
  • Crypto Trades
  • Forex Trades
  • Commodity Trades
Elliott Wave Analysis

Gain a competitive edge with expert insights and AI-powered Elliott Wave charting into:

  • Global Indices
  • US Stocks & ASX Stocks
  • Forex & Crypto
  • Commodities
Top-Notch Trading Tools

Equip yourself with the tools of success:

  • Real-time Chat rooms
  • Elliott Wave Algorithm
  • Portfolio tools
  • TradingLevels
  • Screener
  • Trading Game
7 Elliott Wave Analysts

Stay ahead of the market with daily charts and insightful videos
Your secret to strategic trading!

JOIN HERE


Welcome to TradingLounge (ASIC A.R.No. 321187), specialists in trades, trading education and technical analysis, covering stocks, indices, commodities, forex and cryptocurrencies.

When you join TradingLounge you have access to everything we offer, including trade tools, educational content and a social platform to chat with like-minded investors.

Read more

@Copyright 2024 by tradinglounge.com

Contact Us

Australian no: 02 4787 6020

International no: +61 (2) 47876020

Pay with:

Find us on