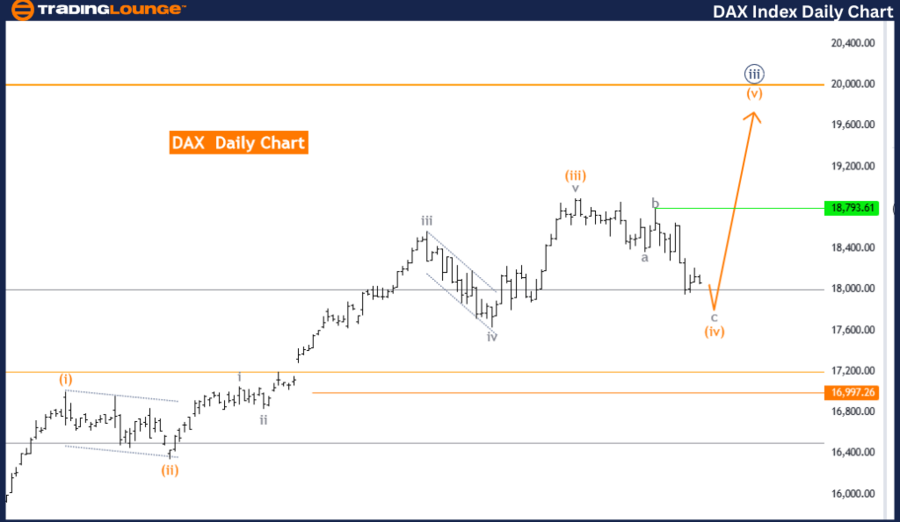
DAX (Germany) Elliott Wave Analysis Trading Lounge Day Chart
DAX (Germany) Elliott Wave Technical Analysis
FUNCTION: Trend
MODE: Corrective
STRUCTURE: Orange wave 4
POSITION: Navy Blue Wave 3
DIRECTION NEXT HIGHER DEGREES: Orange wave 5
WAVE CANCEL INVALID LEVEL: 16997.26
The DAX Germany Elliott Wave analysis on the day chart provides insights into the current market trend using a corrective mode. The focus is on the structure and progression of the waves within the Elliott Wave framework. The analysis identifies the structure as orange wave 4, which is positioned within the larger navy blue wave 3.
The function of this analysis is to track the ongoing trend in the DAX market, currently characterized by a corrective phase. The corrective mode indicates a temporary counter-trend movement that interrupts the primary trend direction, typical in Elliott Wave theory. This corrective phase is part of the broader navy blue wave 3.
The direction for the next higher degrees is identified as orange wave 5. This suggests that once the corrective phase of orange wave 4 concludes, the market is expected to resume its upward trend into orange wave 5, continuing the larger impulsive movement within navy blue wave 3.
The detailed analysis reveals that after completing orange wave 3, the market has entered orange wave 4 of navy blue wave 3. This corrective wave is still in play but appears to be nearing its end. The conclusion of orange wave 4 will likely mark the transition to the next impulsive phase, orange wave 5, within the ongoing trend.
A critical aspect of this analysis is the wave cancel invalid level, set at 16997.26. This level serves as an essential benchmark for validating the current wave structure. If the market price drops below this level, it would invalidate the current wave count, necessitating a reevaluation of the Elliott Wave analysis and potentially altering the market outlook.
In summary, the DAX Germany day chart analysis indicates that the market is currently in a corrective phase within orange wave 4, which is part of the larger navy blue wave 3. With the completion of orange wave 3, the market has transitioned into the corrective phase of orange wave 4, which is nearing its end. The wave cancel invalid level at 16997.26 is crucial for confirming the current wave count and guiding future market expectations based on Elliott Wave principles.
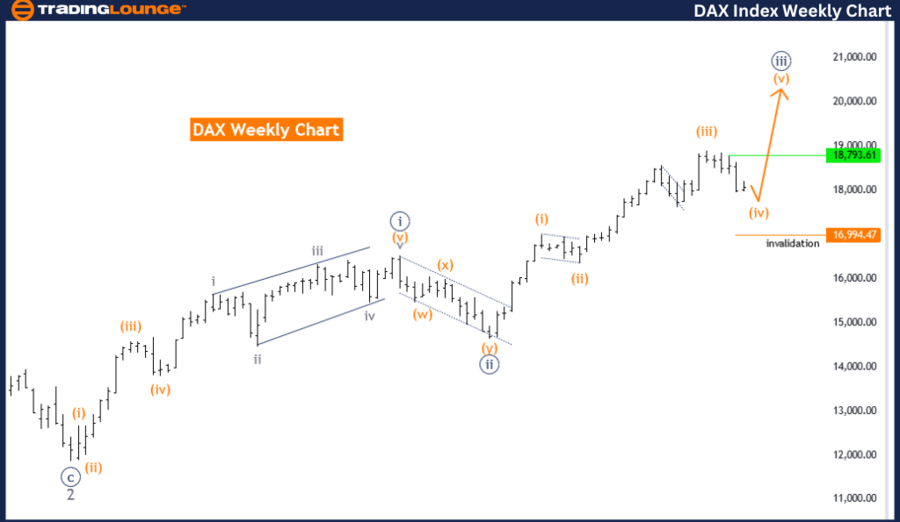
DAX (Germany) Elliott Wave Analysis Trading Lounge Weekly Chart
DAX (Germany) Elliott Wave Technical Analysis
FUNCTION: Trend
MODE: Corrective
STRUCTURE: Orange wave 4
POSITION: Navy blue wave 3
DIRECTION NEXT HIGHER DEGREES: Orange wave 5
WAVE CANCEL INVALID LEVEL: 16944.47
The DAX Germany Elliott Wave analysis on the weekly chart provides a detailed view of the market trend, applying the principles of Elliott Wave theory in a corrective mode. The structure under focus is orange wave 4, positioned within the larger navy blue wave 3. The function of this analysis is to monitor the ongoing market trend, which is currently experiencing a corrective phase.
In Elliott Wave terms, a corrective mode indicates a temporary pause or counter-trend movement that interrupts the primary trend direction. Here, the primary trend is navy blue wave 3, and the market is currently navigating through the corrective phase of orange wave 4.
The next higher degree direction is identified as orange wave 5, suggesting that once the corrective phase of orange wave 4 concludes, the market is anticipated to resume its upward trend, moving into orange wave 5. This would continue the impulsive movement within the broader navy blue wave 3.
The analysis details that after completing orange wave 3, the market has now entered orange wave 4 of navy blue wave 3. This corrective wave is still active but appears to be nearing its end. Once orange wave 4 concludes, the market is expected to transition into the next impulsive phase, orange wave 5, in alignment with the ongoing trend.
A critical element of this analysis is the wave cancel invalid level, set at 16944.47. This level acts as a vital benchmark for confirming the current wave structure. If the market price drops below this level, it would invalidate the existing wave count, necessitating a reevaluation of the Elliott Wave analysis and potentially altering the market outlook.
In summary, the DAX Germany weekly chart analysis indicates that the market is currently in a corrective phase within orange wave 4, which is part of the larger navy blue wave 3. After completing orange wave 3, the market has transitioned into the corrective phase of orange wave 4, which is nearing its end. The wave cancel invalid level at 16944.47 is crucial for validating the current wave count and guiding future market expectations based on Elliott Wave principles.
Technical Analyst: Malik Awais
Source: visit Tradinglounge.com and learn From the Experts Join TradingLounge Here
See previous: FTSE 100 Index Elliott Wave Technical Analysis
Special Trial Offer - 0.76 Cents a Day for 3 Months! Click here
Access 7 Analysts Over 170 Markets Covered. Chat Room With Support