23Jan

TASI Index Elliott Wave Analysis – Saudi Stock Market Chart Insights To Help Traders Manage Risk and Optimize their Trading Strategies

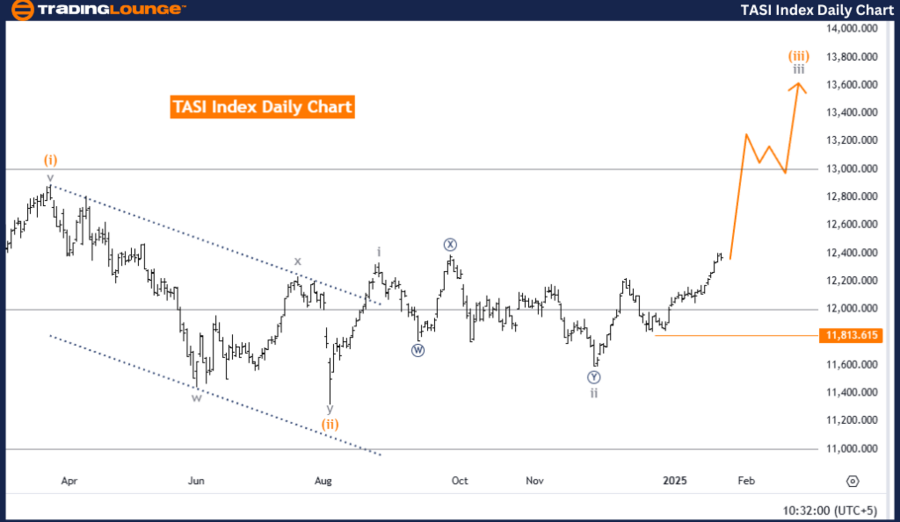
TASI Index Elliott Wave Analysis – TradingLounge Daily Chart

TASI Index Elliott Wave Technical Analysis

Technical Analysis Overview

  • Function: Bullish Trend
  • Mode: Impulsive
  • Structure: Gray Wave 3
  • Position: Orange Wave 3
  • Direction (Next Higher Degrees): Gray Wave 3 (Initiated)
  • Details: Gray Wave 2 concluded, and Gray Wave 3 is now in progress.
  • Wave Invalidation Level: 11,813.615

This analysis of the TASI Index on the daily chart, utilizing Elliott Wave Theory, highlights a bullish trend in an impulsive mode. The focus is on the development of Gray Wave 3, which began after the successful completion of Gray Wave 2, indicating a significant upward momentum in the market.

Currently, the index is positioned within Orange Wave 3, which forms a part of the larger Gray Wave 3 structure. The emergence of Orange Wave 3 confirms ongoing bullish momentum, in alignment with the higher-degree wave, suggesting a potential continuation of the price rally.

The critical invalidation level is set at 11,813.615, which acts as an important threshold. A decline below this level would invalidate the current bullish wave count, necessitating a revised market analysis and adjustment in wave positioning.

Key Takeaways:

  • The analysis affirms a positive outlook for the TASI Index, emphasizing the strength of the ongoing Gray Wave 3, following the completion of Gray Wave 2.
  • The presence of Orange Wave 3 reflects continued bullish strength, presenting strategic opportunities for traders.
  • The invalidation level at 11,813.615 serves as a crucial benchmark for risk management, ensuring informed decision-making based on Elliott Wave principles.
  • This Elliott Wave-based assessment offers a clear market forecast, enabling traders to align their trading strategies with the prevailing bullish trend.

TASI-Index-Daily-Cha...


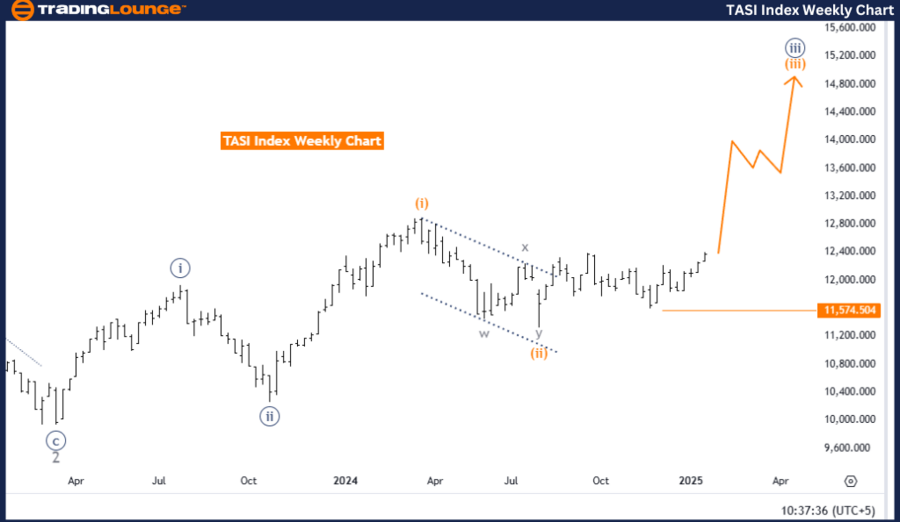
TASI Index Elliott Wave Analysis – Weekly Chart

TASI Index Wave Technical Analysis

Technical Analysis Overview

  • Function: Bullish Trend
  • Mode: Impulsive
  • Structure: Orange Wave 3
  • Position: Navy Blue Wave 3
  • Direction (Next Higher Degrees): Orange Wave 3 (Initiated)
  • Details: Orange Wave 2 completed, and Orange Wave 3 is currently in progress.
  • Wave Invalidation Level: 11,574.504

The TASI Index weekly chart analysis, grounded in Elliott Wave Theory, indicates a bullish trend with an impulsive wave structure. The primary focus lies in the development of Orange Wave 3, which has commenced following the completion of Orange Wave 2, suggesting the continuation of the market's upward trajectory.

Currently, the index is situated within Navy Blue Wave 3, a subwave within the broader Orange Wave 3 framework. The advancement of Navy Blue Wave 3 underscores sustained bullish momentum, aligning with the larger Elliott Wave pattern and pointing towards further potential price growth.

The invalidation level for this wave count is set at 11,574.504, serving as a key indicator for market evaluation. A drop below this threshold would nullify the current bullish outlook, warranting a reassessment of the wave structure and overall market direction.

Key Takeaways:

  • The weekly analysis maintains a bullish outlook, driven by the ongoing Orange Wave 3, following the successful conclusion of Orange Wave 2.

  • The development of Navy Blue Wave 3 signifies sustained upward momentum, presenting traders with potential opportunities for informed market positioning.
  • The invalidation level of 11,574.504 provides a critical reference for risk mitigation and strategy reassessment.
  • This structured wave analysis offers traders a comprehensive framework for forecasting market movements and optimizing their trading approach in line with the bullish trend.

Technical Analyst: Malik Awais

Source: visit Tradinglounge.com and learn From the Experts Join TradingLounge Here 

Previous: Shanghai Composite Elliott Wave Technical Analysis

VALUE Offer - Buy 1 Month & Get 3 Months!Click here

Access 7 Analysts Over 200 Markets Covered. Chat Room With Support

TASI-Index-Weekly-Ch...

Related

Unlock Euro/ U.S. Dollar (EURUSD) Elliott Wave Technical Analysis: Daily Chart Insights and Forex Trading Strategies

Unlock Euro/ U.S. Dollar (EURUSD) Elliott Wave Technical Analysis: Daily Chart Insights and Forex Trading Strategies

This in-depth EURUSD Elliott Wave analysis provides a clear overview of the daily and 4-hour chart t...

Read More >
COLES GROUP LIMITED (ASX:COL) Elliott Wave Analysis, Stock Forecast, and Investment Strategy for Informed Trading Decisions

COLES GROUP LIMITED (ASX:COL) Elliott Wave Analysis, Stock Forecast, and Investment Strategy for Informed Trading Decisions

COLES GROUP LIMITED (ASX:COL) Elliott Wave technical analysis offers valuable insights into stock tr...

Read More >
Effective Elliott Wave analysis of REA Group on the ASX Market with Offers Detailed Stock Predictions, and Trading Strategies

Effective Elliott Wave analysis of REA Group on the ASX Market with Offers Detailed Stock Predictions, and Trading Strategies

Delve into a comprehensive Elliott Wave analysis of REA Group on the ASX. This article offers detail...

Read More >
A detailed FTSE 100 (UK) Index Elliott Wave Technical Analysis: It Explores the current market trend

A detailed FTSE 100 (UK) Index Elliott Wave Technical Analysis: It Explores the current market trend

This article provides a detailed FTSE 100 Elliott Wave analysis for both day and weekly charts. It e...

Read More >
Bitcoin Crypto Price Analysis: Today BTCUSD Elliott Wave Technical Analysis and bullish trend forecasts

Bitcoin Crypto Price Analysis: Today BTCUSD Elliott Wave Technical Analysis and bullish trend forecasts

Get the latest BTCUSD analysis and Bitcoin Elliott Wave technical insights. Our detailed BTCUSD trad...

Read More >

Buy 1 Month

Get 3 Months!

Special Offer:

Trade Recommendations

Unleash the power of deversified trading with our comprehensive portfolio, covering:

  • Stock Trades
  • Crypto Trades
  • Forex Trades
  • Commodity Trades
Elliott Wave Analysis

Gain a competive edge with expert insights in to:

  • Global Indices
  • US Stocks & ASX Stocks
  • Forex & Crypto
  • Commodities
Top-Notch Trading Tools

Equip yourself with the tools of success:

  • Social Chat
  • Elliott Wave Algorithm
  • Screener
  • TradingLevels
  • Trading Game
7 Elliott Wave Analysts

Stay ahead of the market with daily charts and insightful videos
-Your secret to strategic trading!

JOIN HERE


Welcome to TradingLounge (ASIC A.R.No. 321187), specialists in trades, trading education and technical analysis, covering stocks, indices, commodities, forex and cryptocurrencies.

When you join TradingLounge you have access to everything we offer, including trade tools, educational content and a social platform to chat with like-minded investors.

Read more

@Copyright 2024 by tradinglounge.com

Contact Us

Australian no: 02 4787 6020

International no: +61 (2) 47876020

Pay with:

Find us on