BTCUSD Elliott Wave Analysis – TradingLounge Daily Chart
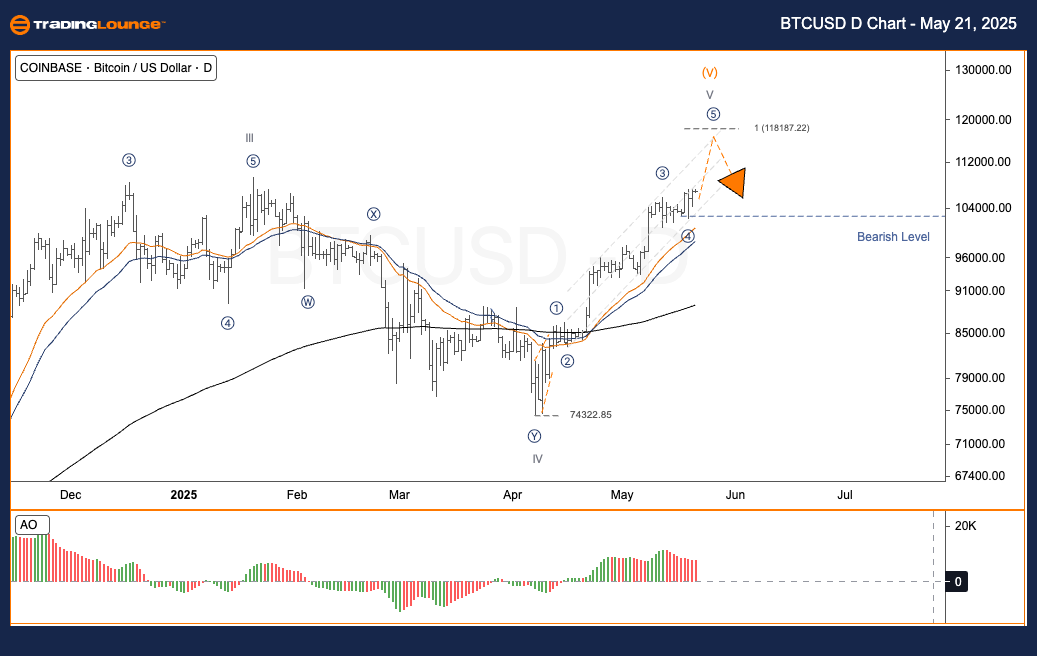
Bitcoin / U.S. Dollar (BTCUSD) Daily Chart Analysis
BTCUSD Elliott Wave Technical Analysis
Function: Counter Trend
Mode: Corrective
Structure: Flat
Position: Wave C
Next Higher Degree Direction: Wave (b)
Wave Cancellation Level: Not Applicable
Analysis Summary:
Bitcoin (BTCUSD) is moving toward finalising wave ⑤, which would conclude the broader wave V cycle. This signals a potential turning point in the mid-term trend direction for BTC.
BTCUSD Trading Strategy – Daily Chart
After rebounding from $74,322.85 in April, Bitcoin formed a strong upward momentum consistent with an impulsive wave structure. It is now entering the final leg of wave ⑤, pointing to the potential end of the primary wave V. The previous wave (4) displayed a classic A-B-C corrective form, and current price behavior suggests that sub-wave (5) is unfolding upward.
Key Fibonacci Price Target:
- Target: $118,187.22 – This aligns with a 100% Fibonacci extension of wave 1.
Trading Strategies
Approach:
Short-Term Strategy (Swing Trading):
- Long traders are recommended to gradually take profits as Bitcoin approaches the $117,000–$118,000 resistance zone.
- Traders anticipating a reversal can prepare for short entries on wave A, post-completion of wave ⑤. Watch for bearish reversal indicators such as RSI divergence or Bearish Engulfing candlestick patterns.
Risk Management:
Status: Data Not Provided
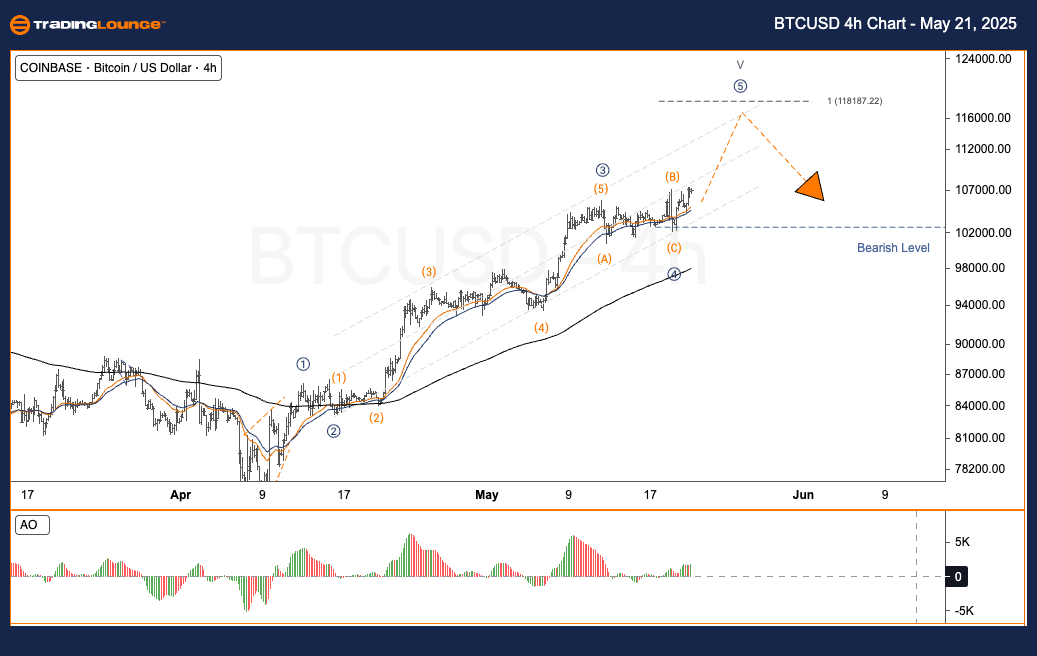
BTCUSD Elliott Wave Analysis – TradingLounge H4 Chart
Bitcoin / U.S. Dollar (BTCUSD) 4-hour Chart Analysis
BTCUSD Elliott Wave Technical Analysis
Function: Counter Trend
Mode: Corrective
Structure: Flat
Position: Wave C
Next Higher Degree Direction: Wave (b)
Wave Cancellation Level: Not Applicable
Analysis Summary:
BTCUSD is nearing the completion of wave ⑤, indicating that the broader wave V cycle is close to finishing. This could mark a significant inflection point in Bitcoin's price action.
BTCUSD Trading Strategy – H4 Chart
Since the April rebound at $74,322.85, Bitcoin has steadily advanced in a textbook impulse wave. Currently, BTC is navigating through the final sub-wave (5) of wave ⑤, which is a crucial part of the wave V cycle.
Targeted Fibonacci Level:
🎯 Target: $118,187.22 – Represents a full 100% extension from wave 1.
Trading Strategies
Approach:
Short-Term Strategy (Swing Trading):
- Profit-taking should be staged near the $117,000–$118,000 range.
- Reversal-oriented traders should be vigilant for technical bearish signals like RSI divergence or reversal candlestick formations to initiate short positions on wave A.
Risk Management:
Status: Data Not Provided
Technical Analyst: Kittiampon Somboonsod, CEWA
Source: Visit Tradinglounge.com and learn from the Experts. Join TradingLounge Here
Previous: XRPUSD Elliott Wave Technical Analysis
VALUE Offer - Buy 1 Month & Get 3 Months!Click here
Access 7 Analysts Over 200 Markets Covered. Chat Room With Support