XRPUSD Elliott Wave Analysis | TradingLounge Daily Chart
XRP / U.S. Dollar (XRPUSD) Daily Chart Analysis
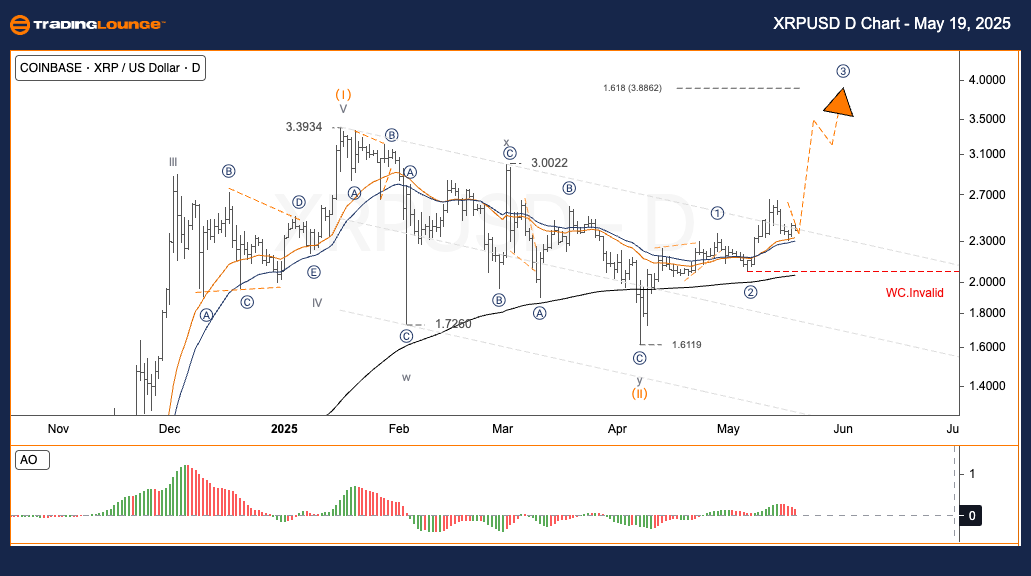
XRPUSD Elliott Wave Technical Analysis
Function: Trend Following
Mode: Motive
Structure: Impulse
Position: Wave 3
Next Higher Degree Direction: —
Wave Cancel Invalid Level: —
XRP / U.S. Dollar (XRPUSD) Forecast & Trading Strategy
After completing the significant corrective wave (II) near the $1.88 level, XRP/USD initiated a new bullish Elliott wave cycle. The formation of wave III is progressing within the guidelines of the Elliott Wave theory. Wave (1) of wave ③ concluded near $2.80, while wave (2) is currently correcting within the standard 50%–61.8% Fibonacci retracement zone, between $2.36 and $2.29. Price has started bouncing off the Base Channel support, maintaining the integrity of the current wave setup.
Trading Strategy for XRPUSD
✅ Swing Trade Opportunity
A confirmed breakout above the $2.65 resistance would mark the start of wave (3) inside wave ③, signalling a potential rapid bullish continuation.
Risk Control
🟥 Invalidation Point
A drop below $2.07 would invalidate the current Elliott Wave count, necessitating a revised outlook.
XRPUSD Elliott Wave Analysis | TradingLounge H4 Chart
XRP / U.S. Dollar (XRPUSD) Pair 4-Hour Chart Analysis
XRPUSD Elliott Wave Technical Analysis
Function: Trend Following
Mode: Motive
Structure: Impulse
Position: Wave 3
Next Higher Degree Direction: —
Wave Cancel Invalid Level: —
XRP / U.S. Dollar (XRPUSD) Short-Term Forecast
Following the termination of corrective wave (II) near $1.88, XRP/USD entered a pronounced uptrend. Within this bullish sequence, wave (1) of wave III ended close to $2.80. The current wave (2) pullback has reached the typical Fibonacci retracement zone of $2.36 to $2.29. Market activity is signaling a rebound from the Base Channel, maintaining structural compliance with the Elliott Wave framework.
Trading Strategy for XRPUSD (4-Hour Chart)
✅ Swing Trading Setup
A surge above $2.65 would validate the formation of wave (3) inside wave ③, which could drive a swift upward movement.
Risk Control
🟥 Wave Count Review Trigger
A price move below $2.07 would challenge the current count, requiring reassessment.
Technical Analyst: Kittiampon Somboonsod, CEWA
Source: Visit Tradinglounge.com and learn from the Experts. Join TradingLounge Here
Previous: THETAUSD Elliott Wave Technical Analysis
VALUE Offer - Buy 1 Month & Get 3 Months!Click here
Access 7 Analysts Over 200 Markets Covered. Chat Room With Support
