16May

Theta Token (THETAUSD) Elliott Wave Analysis: Unveiling Price Predictions, Wave Structures, and Strategic Trading Insights

THETAUSD Elliott Wave Analysis – Daily Chart Overview | TradingLounge

Technical Summary: THETA Elliott Wave Analysis

Function: Trend-Following

Mode: Motive

Wave Structure: Impulse

Current Position: Wave ④

Anticipated Move: Continuation to Wave ⑤

Invalidation Level: Below $0.672

THETA/USD Forecast & Trading Strategy

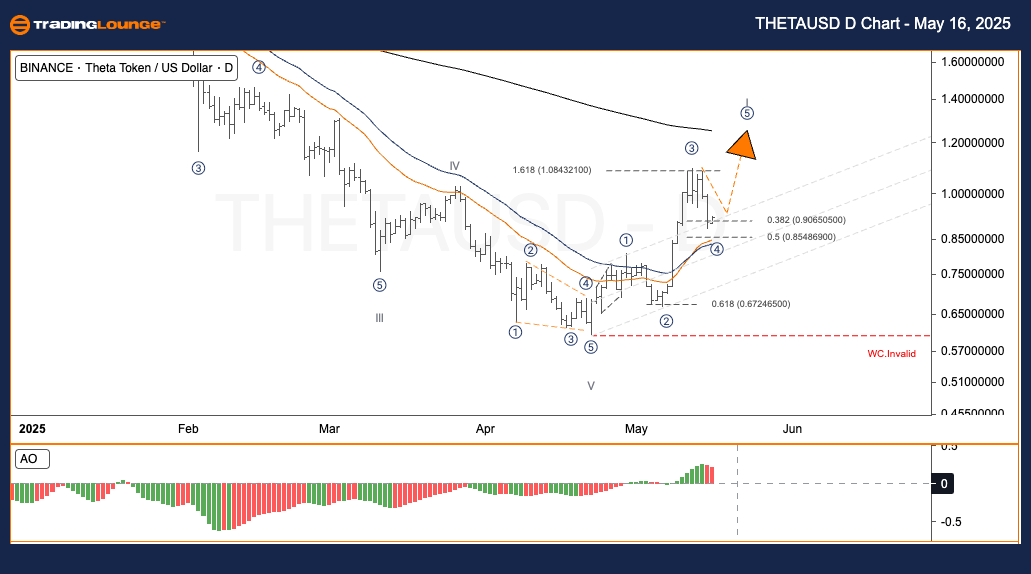
Theta (THETA) has recently concluded a corrective phase, completing Wave V at a crucial support level. This marks the start of a potential new bullish structure. Currently, an Impulse Wave I is taking shape, and price action suggests it is in the Wave ④ phase.

Price is testing the key Fibonacci Retracement zone between 38.2% and 50%, or roughly $0.906 – $0.854, from Wave ③. A sustained hold above this level followed by an upward move could confirm the onset of Wave ⑤, the final upward wave in this cycle.

Swing Trading Strategy – Daily Chart

Buy Zone: Watch for bullish entries between $0.85 – $0.90, especially upon confirmation of a reversal pattern.

🟥 Risk Level: A drop below $0.672 invalidates the bullish count and warrants reevaluation.

THETAUSD-d-Crypto-Ch...


THETAUSD Elliott Wave Analysis – 4-Hour Chart | TradingLounge

Technical Summary: Elliott Wave THETA/USD

Function: Trend-Following

Mode: Motive

Wave Structure: Impulse

Current Position: Wave ④

Next Target: Wave ⑤

Wave Invalidation Level: Below $0.672

Short-Term Trading Strategy – THETAUSD 4H Outlook

Following a strong V wave formation at a major support, Theta (THETA) is showing signs of recovery. The chart indicates formation of Impulse Wave I, with current action likely forming Wave ④.

Price is consolidating within the 38.2% – 50% Fibonacci retracement zone ($0.906 – $0.854) from Wave ③. Sustaining this level could signal the next leg up, Wave ⑤, completing the bullish cycle.

Swing Trader Setup – 4H Chart

Buy Opportunity: Focus on the $0.85 – $0.90 area, particularly if a reversal candlestick pattern confirms upward momentum.

🟥 Risk Alert: Falling below $0.672 negates the bullish scenario and suggests a new wave count.

Technical Analyst: Kittiampon Somboonsod, CEWA

Source: Visit Tradinglounge.com and learn from the Experts. Join TradingLounge Here 

Previous: XRPUSD Elliott Wave Technical Analysis

VALUE Offer - Buy 1 Month & Get 3 Months!Click here

Access 7 Analysts Over 200 Markets Covered. Chat Room With Support

THETAUSD-4h-Crypto-C...

Related

Elliott Wave Trading Strategies: SP500, NASDAQ, Tech Stocks & Bitcoin Analysis

Elliott Wave Trading Strategies: SP500, NASDAQ, Tech Stocks & Bitcoin Analysis

The SP500, NASDAQ, and key tech stocks are approaching a crucial Elliott Wave phase—Wave iii) of 3 ...

Read More >
Elliott Wave Analysis on ASX Stock RIO Tinto (RIO) Provides Investors with a Detailed Look at Current Trends and Trading Strategies

Elliott Wave Analysis on ASX Stock RIO Tinto (RIO) Provides Investors with a Detailed Look at Current Trends and Trading Strategies

Our comprehensive Elliott Wave analysis on ASX: RIO Tinto (RIO) provides investors with a detailed l...

Read More >
Invest in Hang Seng Stocks, Explore the Best Options, and Stay Informed: Hang Seng Index Elliott Wave Technical Analysis

Invest in Hang Seng Stocks, Explore the Best Options, and Stay Informed: Hang Seng Index Elliott Wave Technical Analysis

The Hang Seng Index is a pivotal focus for investors seeking to navigate the complexities of the Hon...

Read More >
Insights into the Current Trends in the ASX Market: ASX LIMITED Stock Analysis & ASX Elliott Wave Technical Forecast

Insights into the Current Trends in the ASX Market: ASX LIMITED Stock Analysis & ASX Elliott Wave Technical Forecast

This article provides an in-depth Elliott Wave analysis of ASX Limited, focusing on its potential pr...

Read More >
Unveiling Impulsive Momentum - EUR/USD Elliott Wave Analysis Reveals Bullish Trends Across Timeframes

Unveiling Impulsive Momentum - EUR/USD Elliott Wave Analysis Reveals Bullish Trends Across Timeframes

The EUR/USD Elliott Wave Analysis for both the day and 4-hour charts highlights a prevailing trend s...

Read More >
GBPUSD Elliott Wave Analysis Reveals Bullish Impulse Wave Pattern and Forecast on Daily and 4-Hour Charts for Forex Traders

GBPUSD Elliott Wave Analysis Reveals Bullish Impulse Wave Pattern and Forecast on Daily and 4-Hour Charts for Forex Traders

Elliott Wave analysis of GBPUSD, highlighting bullish trends and impulse wave patterns. It includes ...

Read More >

$1 for 2 Weeks

then $29 a month!

What a Special Offer!

Trade Recommendations

Unleash the power of deversified trading with our comprehensive portfolio, covering 250+ markets:

  • Stock Trades
  • Crypto Trades
  • Forex Trades
  • Commodity Trades
Elliott Wave Analysis

Gain a competitive edge with expert insights and AI-powered Elliott Wave charting into:

  • Global Indices
  • US Stocks & ASX Stocks
  • Forex & Crypto
  • Commodities
Top-Notch Trading Tools

Equip yourself with the tools of success:

  • Real-time Chat rooms
  • Elliott Wave Algorithm
  • Portfolio tools
  • TradingLevels
  • Screener
  • Trading Game
7 Elliott Wave Analysts

Stay ahead of the market with daily charts and insightful videos
Your secret to strategic trading!

JOIN HERE


Welcome to TradingLounge (ASIC A.R.No. 321187), specialists in trades, trading education and technical analysis, covering stocks, indices, commodities, forex and cryptocurrencies.

When you join TradingLounge you have access to everything we offer, including trade tools, educational content and a social platform to chat with like-minded investors.

Read more

@Copyright 2024 by tradinglounge.com

Contact Us

Australian no: 02 4787 6020

International no: +61 (2) 47876020

Pay with:

Find us on