15May

XRP Price Prediction: Elliott Wave Signals Bullish Breakout to $3.88 with Key Fibonacci Zones for Swing Trade Opportunities

XRPUSD Elliott Wave Analysis – TradingLounge Daily Chart

XRP/USD (Ripple to U.S. Dollar) Daily Chart Analysis

XRPUSD Elliott Wave Technical Analysis

Function: Trend Following

Mode: Motive

Structure: Impulse

Current Wave: Wave 3

Next Higher Degree Direction: Bullish Continuation

Invalidation Level: Below Critical Support

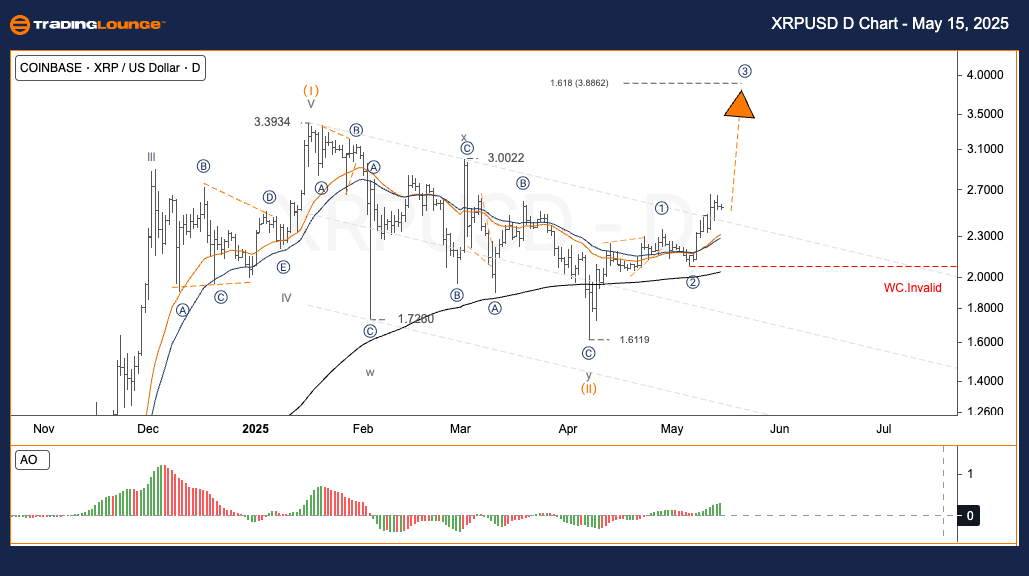
XRP/USD Daily Chart Forecast: Bullish Wave ③ Breakout Potential

XRP is entering a critical phase in its Elliott Wave cycle, targeting wave ③ formation. A retracement to wave (2) would confirm continued bullish momentum, reinforcing a potential surge toward the $3.88 price target. Traders analyzing XRP/USD should focus on the Fibonacci retracement levels, where trend continuation opportunities may emerge.

XRPUSD Trading Strategy – Daily Chart

Strategy Type:
✅ Swing Trade (Short-Term)

  • Identify bullish reversal signals in the $2.27–$2.34 zone.
  • Use Fibonacci support zones for optimized trade entries.

Risk Management:
🟥 Protective Stop-Loss:
Place stop-loss orders below $2.00 to avoid invalidation of the current Elliott Wave setup.

XRPUSD-day-crypto-ch...


XRP/USD Elliott Wave Analysis – TradingLounge H4 Chart

XRP/USD (Ripple to U.S. Dollar) 4-Hour Chart Analysis

XRPUSD Elliott Wave Technical Analysis

Function: Trend Following

Mode: Motive

Structure: Impulse

Current Wave: Wave 3

Next Higher Degree Direction: Bullish Continuation

Invalidation Level: Below Critical Support

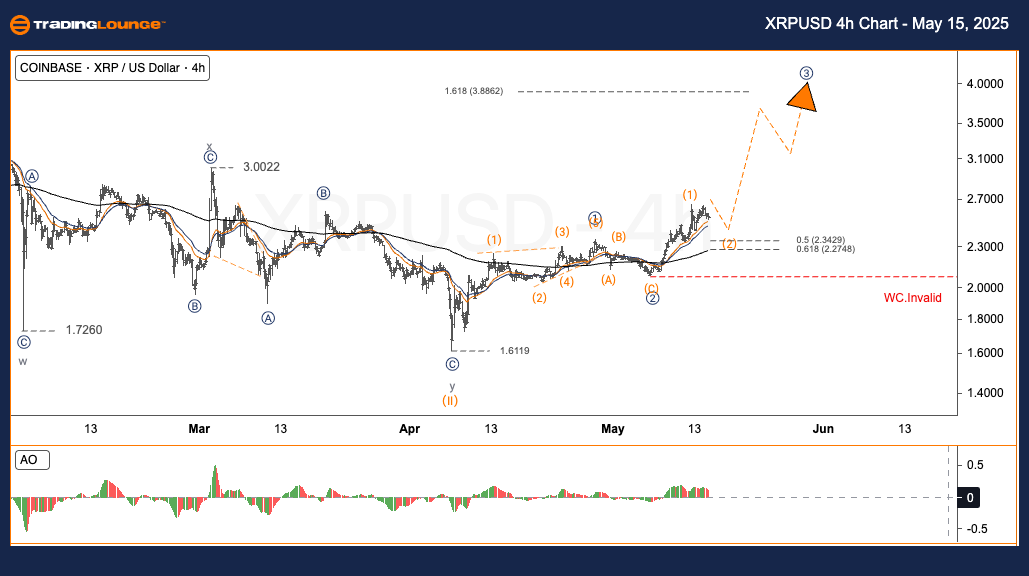
XRP/USD H4 Chart Analysis: Short-Term Rally Anticipation

The H4 chart reinforces the bullish outlook as XRP prepares for the next impulsive leg in wave ③. Confirmation of wave (2) will likely set the stage for a potential move toward the $3.88 mark. This XRP technical analysis highlights the importance of monitoring Fibonacci zones to capitalise on emerging trends.

Trading Strategy – H4 Chart

Strategy Type:
✅ Swing Trade (Short-Term)

Watch for price action setups in the $2.27–$2.34 range to trigger buy entries.

Risk Management:
🟥 Stop-Loss Strategy

Set stop-losses below $2.00 to mitigate downside risk if wave structure fails.

Technical Analyst: Kittiampon Somboonsod, CEWA

Source: Visit Tradinglounge.com and learn from the Experts. Join TradingLounge Here 

Previous: LINKUSD Elliott Wave Technical Analysis

VALUE Offer - Buy 1 Month & Get 3 Months!Click here

Access 7 Analysts Over 200 Markets Covered. Chat Room With Support

XRPUSD-4h-crypto-cha...

Related

Unlocking ASX Trading Success: BLOCK INC. - SQ2 Stock Analysis & Elliott Wave Technical Forecast

Unlocking ASX Trading Success: BLOCK INC. - SQ2 Stock Analysis & Elliott Wave Technical Forecast

This article provides an expert Elliott Wave analysis of BLOCK INC. - SQ2 on the Australian Stock Ex...

Read More >
Euro/U.S.Dollar(EURUSD) Day Chart Elliott Wave Technical Analysis 10 November 23

Euro/U.S.Dollar(EURUSD) Day Chart Elliott Wave Technical Analysis 10 November 23

Euro/U.S.Dollar(EURUSD) Day Chart Elliott Wave Technical Analysis 10 November 23 suggests a Counter ...

Read More >
Elliott Wave Commodity Market Analysis: Bitcoin, ETH/USD, Bonds, USD, Gold, Silver, Copper, Uranium, Crude Oil, Natural Gas Insights

Elliott Wave Commodity Market Analysis: Bitcoin, ETH/USD, Bonds, USD, Gold, Silver, Copper, Uranium, Crude Oil, Natural Gas Insights

Commodity Market Elliott Wave Analysis Update: - Bitcoin (BTC) and Ethereum (ETH/USD): Advancing in...

Read More >
Australian Dollar/U.S. Dollar (AUDUSD) Elliott Wave Analysis: Forecast Trends and Market Outlook for Forex Traders

Australian Dollar/U.S. Dollar (AUDUSD) Elliott Wave Analysis: Forecast Trends and Market Outlook for Forex Traders

AUDUSD Elliott Wave analysis provides a detailed outlook on market trends, including wave counts, tr...

Read More >
Cocoa Commodity Analysis & Elliott Wave Technical Forecast: Navigating the Bullish Waves

Cocoa Commodity Analysis & Elliott Wave Technical Forecast: Navigating the Bullish Waves

This comprehensive analysis provides a deep dive into the cocoa market's bullish trend, leveragi...

Read More >
BLOCK, INC - XYZ (SQ2) Elliott Wave Analysis & Elliott Wave Technical Chart Predicts Bullish Target with Key Support Holding

BLOCK, INC - XYZ (SQ2) Elliott Wave Analysis & Elliott Wave Technical Chart Predicts Bullish Target with Key Support Holding

This article provides a complete Elliott Wave analysis for ASX: BLOCK INC - SQ2, highlighting a bull...

Read More >

$1 for 2 Weeks

then $29 a month!

What a Special Offer!

Trade Recommendations

Unleash the power of deversified trading with our comprehensive portfolio, covering 250+ markets:

  • Stock Trades
  • Crypto Trades
  • Forex Trades
  • Commodity Trades
Elliott Wave Analysis

Gain a competitive edge with expert insights and AI-powered Elliott Wave charting into:

  • Global Indices
  • US Stocks & ASX Stocks
  • Forex & Crypto
  • Commodities
Top-Notch Trading Tools

Equip yourself with the tools of success:

  • Real-time Chat rooms
  • Elliott Wave Algorithm
  • Portfolio tools
  • TradingLevels
  • Screener
  • Trading Game
7 Elliott Wave Analysts

Stay ahead of the market with daily charts and insightful videos
Your secret to strategic trading!

JOIN HERE


Welcome to TradingLounge (ASIC A.R.No. 321187), specialists in trades, trading education and technical analysis, covering stocks, indices, commodities, forex and cryptocurrencies.

When you join TradingLounge you have access to everything we offer, including trade tools, educational content and a social platform to chat with like-minded investors.

Read more

@Copyright 2024 by tradinglounge.com

Contact Us

Australian no: 02 4787 6020

International no: +61 (2) 47876020

Pay with:

Find us on