30Apr

ASX: CAR GROUP LIMITED – CAR Stock Analysis & Elliott Wave Technical Analysis Suggests Wave Correction Completes

ASX: CAR GROUP LIMITED – CAR Elliott Wave Technical Analysis – TradingLounge (Daily Chart)

Welcome!
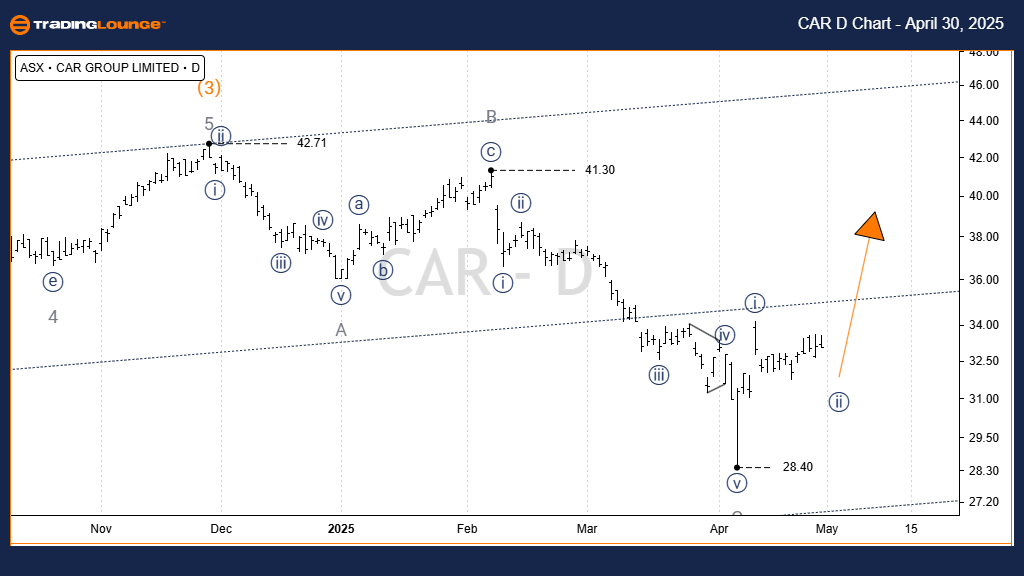
Today’s Elliott Wave analysis focuses on CAR GROUP LIMITED (ASX: CAR). Based on our technical outlook, the stock appears to have completed a wave (4) – orange Zigzag correction, suggesting the potential beginning of a bullish wave (5) movement. Below, we provide key price levels and trend projections.

ASX: CAR GROUP LIMITED Elliott Wave Analysis – TradingLounge (Daily Chart)

ASX: CAR GROUP LIMITED 1d Chart – Technical Overview (Semilog Scale)

Trend Type: Intermediate (Orange Degree)

Wave Mode: Motive

Structure Type: Impulse

Current Position: Wave ii)) navy of Wave (5) orange

Details:
Wave (4) – orange likely concluded after declining from the 42.71 high to a low of 28.40 in a classic A-B-C Zigzag formation (grey). The C wave clearly subdivided into five smaller waves, indicating completion. This opens the door for wave (5) – orange to advance. The initial move, wave i)) – navy, is complete. Currently, wave ii)) – navy is unfolding and may dip slightly further before wave iii)) – navy resumes the upward trend.

Invalidation Point: 28.40 – A price drop below this level would invalidate the current bullish wave count.

CAR-ASX-Day-Chart-30...


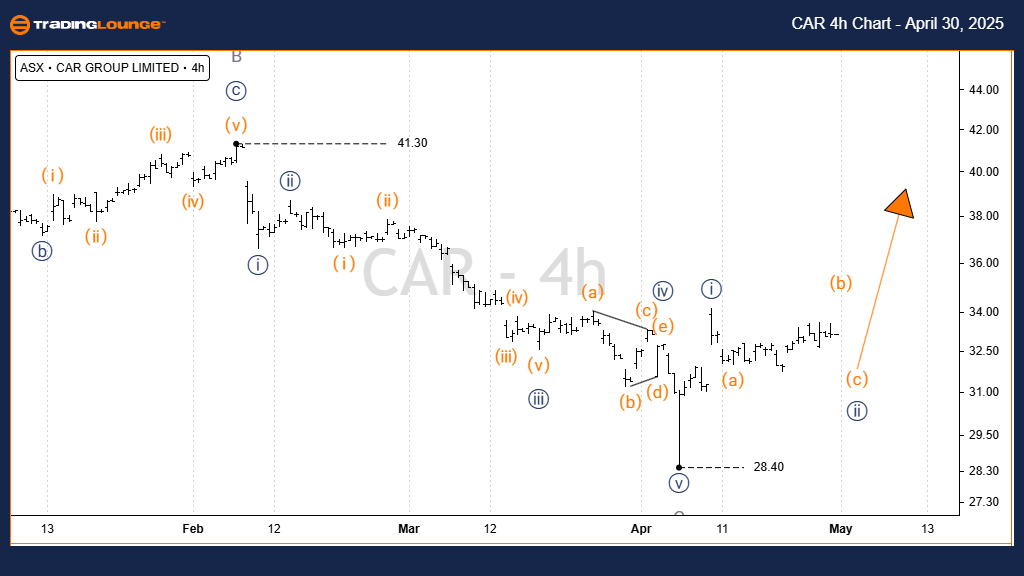
ASX: CAR GROUP LIMITED Elliott Wave Analysis – TradingLounge (4-Hour Chart)

Trend Type: Minor (Grey Degree)

Wave Mode: Motive

Structure Type: Impulse

Current Position: Wave ((ii)) navy of Wave (5) orange

Details:
Following the low at 28.40, the stock initiated wave i)) – navy, which has now completed. The market is currently correcting in wave ii)) – navy, which is still in progress. Once this retracement completes, wave iii)) – navy is expected to push higher, potentially revisiting the prior swing high near 41.30.

Invalidation Point: 28.40 – Price must stay above this support level to maintain the current bullish Elliott Wave forecast.

Technical Analyst: Hua (Shane) Cuong, CEWA-M (Master’s Designation).

Source: Visit Tradinglounge.com and learn from the Experts. Join TradingLounge Here 

See Previous: IAG Elliott Wave Technical Analysis

VALUE Offer - Buy 1 Month & Get 3 Months!Click here

Access 7 Analysts Over 200 Markets Covered. Chat Room With Support

CAR-ASX-4h-Chart-300...


Conclusion
Our Elliott Wave analysis for CAR GROUP LIMITED (ASX: CAR) identifies key trend phases and invalidation levels to guide strategic trading. With a completed correction and a developing impulse structure, the setup provides a roadmap for potential upside—supported by precise price validation points for confidence in trading execution.

Related

Strategic insights for traders on Bitcoin Crypto Price News Today Elliott Wave Technical Analysis

Strategic insights for traders on Bitcoin Crypto Price News Today Elliott Wave Technical Analysis

In this article, we provide a comprehensive BTCUSD Elliott Wave analysis focusing on Bitcoin's p...

Read More >
Unlocking ASX Trading Success: TRANSURBAN GROUP – TCL Stock Analysis & Elliott Wave Technical Forecast

Unlocking ASX Trading Success: TRANSURBAN GROUP – TCL Stock Analysis & Elliott Wave Technical Forecast

The Transurban Group's stock performance (TCL) on the ASX through the lens of Elliott Wave theor...

Read More >
Dogecoin Elliott Wave Analysis: DOGE Price Prediction, Wave Count, Support & Resistance Levels for Crypto Investors

Dogecoin Elliott Wave Analysis: DOGE Price Prediction, Wave Count, Support & Resistance Levels for Crypto Investors

Dogecoin Elliott Wave analysis, helping traders understand the DOGEUSD market structure. Learn about...

Read More >
Comprehensive UnitedHealth Group Inc. (UNH) Stock Analysis: Elliott Wave Insights, Technical Forecast, and Trading Strategies

Comprehensive UnitedHealth Group Inc. (UNH) Stock Analysis: Elliott Wave Insights, Technical Forecast, and Trading Strategies

Dive into detailed Elliott Wave analysis for UNH stock, uncovering trend patterns, corrective moveme...

Read More >
Polkadot/U.S. dollar(DOTUSD) Elliott Wave Technical Analysis 19 October 23

Polkadot/U.S. dollar(DOTUSD) Elliott Wave Technical Analysis 19 October 23

DOTUSD Elliott Wave Analysis TradingLounge Daily and 4-hour Chart for 19 October 23.

Read More >

Buy 1 Month

Get 3 Months!

Special Offer:

Trade Recommendations

Unleash the power of deversified trading with our comprehensive portfolio, covering:

  • Stock Trades
  • Crypto Trades
  • Forex Trades
  • Commodity Trades
Elliott Wave Analysis

Gain a competive edge with expert insights in to:

  • Global Indices
  • US Stocks & ASX Stocks
  • Forex & Crypto
  • Commodities
Top-Notch Trading Tools

Equip yourself with the tools of success:

  • Social Chat
  • Elliott Wave Algorithm
  • Screener
  • TradingLevels
  • Trading Game
7 Elliott Wave Analysts

Stay ahead of the market with daily charts and insightful videos
-Your secret to strategic trading!

JOIN HERE


Welcome to TradingLounge (ASIC A.R.No. 321187), specialists in trades, trading education and technical analysis, covering stocks, indices, commodities, forex and cryptocurrencies.

When you join TradingLounge you have access to everything we offer, including trade tools, educational content and a social platform to chat with like-minded investors.

Read more

@Copyright 2024 by tradinglounge.com

Contact Us

Australian no: 02 4787 6020

International no: +61 (2) 47876020

Pay with:

Find us on