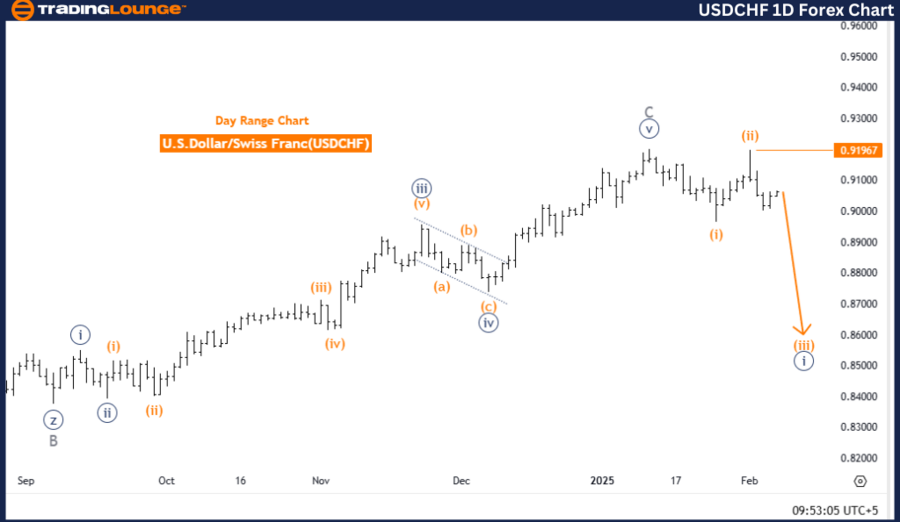
U.S. Dollar / Swiss Franc (USDCHF) Elliott Wave Analysis | Trading Lounge Daily Chart
USDCHF Elliott Wave Technical Analysis
Function: Bearish Trend
Mode: Impulsive
Structure: Orange Wave 3
Position: Navy Blue Wave 1
Next Lower Degree Direction: Orange Wave 3 (Active)
Details: Orange wave 2 within navy blue wave 1 has likely completed, and orange wave 3 is now progressing.
Wave Cancel Invalidation Level: 0.91967
The USDCHF daily chart analysis, based on Elliott Wave Theory, indicates a strong bearish trend in an impulsive phase. The focus is on orange wave 3, which follows the completion of orange wave 2 within navy blue wave 1.
As orange wave 2 transitions into orange wave 3, selling pressure increases, driving downward momentum. This phase typically leads to sharp price declines, reinforcing the overall bearish sentiment.
With navy blue wave 1 shaping the broader outlook, the market is expected to move lower. The progression of orange wave 3 is a key focus, and traders should monitor price action for continuation signals or potential retracements.
The wave cancel invalidation level is set at 0.91967. A break above this level would invalidate the current Elliott Wave structure, requiring a market reassessment. Keeping track of this level is essential for confirming the ongoing impulsive trend or spotting potential deviations.
Conclusion
The USDCHF daily chart supports a bearish outlook, driven by the development of orange wave 3 within navy blue wave 1. With orange wave 2 completed, traders should expect stronger downward price movements. Monitoring the invalidation level remains crucial to refine trading strategies and ensure accurate market analysis.
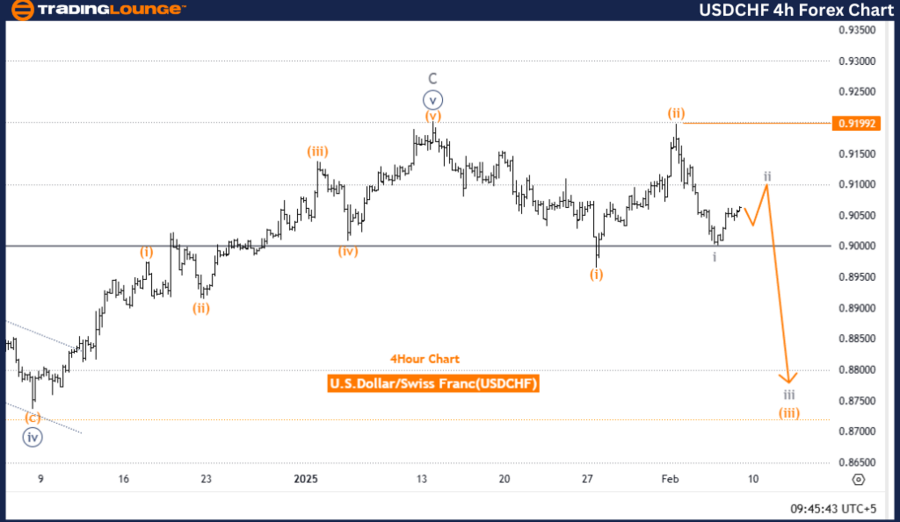
U.S. Dollar / Swiss Franc (USDCHF) Elliott Wave Analysis | Trading Lounge 4-Hour Chart
USDCHF Elliott Wave Technical Analysis
Function: Counter-Trend
Mode: Corrective
Structure: Gray Wave 2
Position: Orange Wave 3
Next Lower Degree Direction: Gray Wave 3
Details: Gray wave 1 within orange wave 3 appears complete; gray wave 2 is currently unfolding.
Wave Cancel Invalidation Level: 0.91992
The USDCHF 4-hour chart analysis based on Elliott Wave Theory highlights a corrective counter-trend movement. The focus is on gray wave 2 within orange wave 3, marking a transitional phase in market dynamics.
The completion of gray wave 1 suggests that the market has entered gray wave 2, a corrective phase typically characterized by retracements or consolidation. Before the market transitions into gray wave 3, further corrections and fluctuations are expected.
The wave structure suggests that traders should anticipate sideways movements and temporary retracements. Observing market momentum shifts and price action is crucial to identify potential breakout points.
The wave cancel invalidation level is set at 0.91992. A price move above this level would invalidate the current wave count, requiring a reevaluation of the trend. Monitoring this level closely is key to confirming the corrective structure or spotting a trend shift.
Conclusion
The USDCHF 4-hour chart presents a corrective market phase, with gray wave 2 in play following the completion of gray wave 1. Traders should anticipate retracements or consolidation, keeping a close watch on the invalidation level to fine-tune trading strategies. The next expected move is the potential transition into gray wave 3 within orange wave 3, signaling a return to the impulsive downtrend.
Technical Analyst: Malik Awais
Source: visit Tradinglounge.com and learn From the Experts Join TradingLounge Here
Previous: USDJPY Elliott Wave Technical Analysis
VALUE Offer - Buy 1 Month & Get 3 Months!Click here
Access 7 Analysts Over 200 Markets Covered. Chat Room With Support