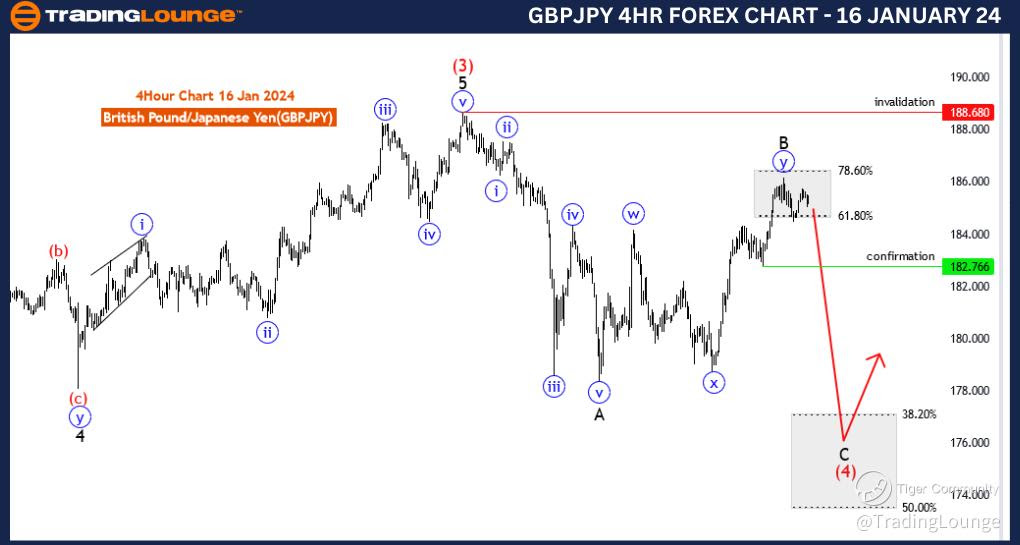
GBPJPY Elliott Wave Analysis Trading Lounge 4 Hour Chart, 16 January 24
British Pound/Japanese Yen(GBPJPY) 4 Hour Chart
GBPJPY Elliott Wave Technical Analysis
Function: Trend
Mode: Corrective
Structure: Black wave C of 4
Position: Blue wave 5
Direction Next Lower Degrees: Red wave 5
Details: black wave B looking completed between fib level 61.80 to 78.60 . Now black wave C may have just started. Wave Cancel invalid level:188.680
The "GBPJPY Elliott Wave Analysis Trading Lounge 4 Hour Chart" dated 16 January 24, provides a comprehensive analysis of the British Pound/Japanese Yen (GBPJPY) currency pair using Elliott Wave theory on a four-hour timeframe. This analysis aims to decipher potential market movements with a specific focus on corrective structures within the broader trend.
The declared "Function" is identified as "Trend," indicating that the analysis is primarily centered on understanding the directional movements of the market. This suggests that the primary goal is to identify trends within the GBPJPY pair.
The specified "Mode" is characterized as "Corrective," suggesting that the current phase of the market is in a corrective state. Corrective phases are critical for traders as they often present opportunities to position themselves for the next impulsive price movement.
The primary "Structure" is described as "Black wave C of 4," signifying that the market is currently within a corrective wave labeled as black wave C within the broader Elliott Wave count. Corrective waves often involve complex price movements and provide opportunities for traders to position themselves for the next phase of the trend.
The identified "Position" is labeled as "Blue wave 5," indicating the potential position within the broader Elliott Wave count. This implies that the current corrective structure (Black wave C of 4) is part of a larger pattern, and blue wave 5 is the anticipated next phase.
In terms of "Direction Next Lower Degrees," the analysis points to the expected "Red wave 5." This signifies that, following the completion of the current corrective structure (Black wave C of 4), the subsequent move is expected to be a corrective wave labeled Red wave 5.
The "Details" section notes that "black wave B looking completed between fib level 61.80 to 78.60." This implies that the preceding corrective wave, black wave B, likely formed within a Fibonacci retracement range. Now, the analysis suggests that black wave C may have just started, indicating the potential beginning of a new phase in the correction.
The "Wave Cancel invalid level" is identified as "188.680." This level serves as a crucial reference point, and if the market surpasses this level, it would invalidate the current wave count, prompting traders to reassess their analysis and potentially indicating a change in the anticipated market direction.
In summary, the GBPJPY Elliott Wave Analysis for the 4-hour chart on 16 January 24, suggests that the market is currently within a corrective phase (Black wave C of 4), with a potential start of the next corrective wave (Red wave 5). Traders are advised to monitor the progression of the correction and consider the invalidation level at 188.680.
Technical Analyst: Malik Awais
Source: Tradinglounge.com get trial here!
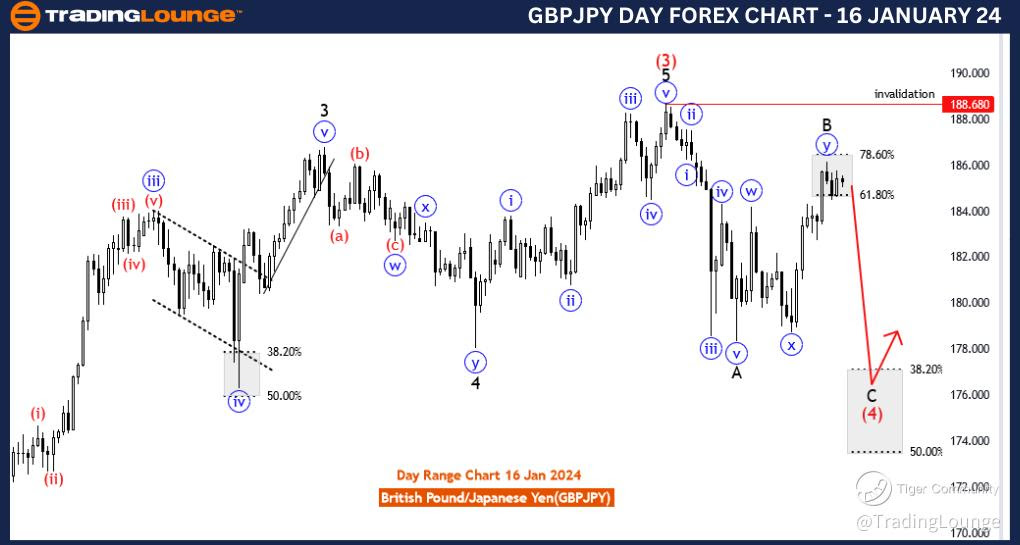
GBPJPY Elliott Wave Analysis Trading Lounge Day Chart, 16 January 24
British Pound/Japanese Yen(GBPJPY) Day Chart
GBPJPY Elliott Wave Technical Analysis
Function: Trend
Mode: Corrective
Structure: Black wave C of 4
Position: Blue wave 5
Direction Next Higher Degrees: Red wave 5
Details: black wave B looking completed between fib level 61.80 to 78.60 . Now black wave C may have just started. Wave Cancel invalid level:188.680
The "GBPJPY Elliott Wave Analysis Trading Lounge Day Chart" dated 16 January 24, offers a detailed analysis of the British Pound/Japanese Yen (GBPJPY) currency pair using Elliott Wave theory on a daily timeframe. The analysis is geared towards understanding potential market movements, with a specific focus on corrective structures within the broader trend.
The identified "Function" is labeled as "Trend," indicating that the analysis primarily seeks to understand the directional movements of the market. This suggests a focus on identifying trends within the GBPJPY pair.
The specified "Mode" is characterized as "Corrective," suggesting that the current phase of the market is corrective in nature. Corrective phases are crucial for traders as they often precede or follow impulsive price movements.
The primary "Structure" is described as "Black wave C of 4," signifying that the market is within a corrective wave labeled as black wave C within the broader Elliott Wave count. Corrective waves often involve complex price movements and provide opportunities for traders to position themselves for the next phase of the trend.
The identified "Position" is labeled as "Blue wave 5," indicating the potential position within the broader Elliott Wave count. This suggests that the current corrective structure (Black wave C of 4) is part of a larger pattern, and blue wave 5 is the anticipated next phase.
In terms of "Direction Next Higher Degrees," the analysis points to the expected "Red wave 5." This signifies that, following the completion of the current corrective structure (Black wave C of 4), the subsequent move is expected to be an impulsive wave labeled Red wave 5.
The "Details" section notes that "black wave B looking completed between fib level 61.80 to 78.60." This implies that the preceding corrective wave, black wave B, likely formed within a Fibonacci retracement range. Now, the analysis suggests that black wave C may have just started, indicating the potential beginning of a new phase in the correction.
The "Wave Cancel invalid level" is identified as "188.680." This level serves as a crucial reference point, and if the market surpasses this level, it would invalidate the current wave count, prompting traders to reassess their analysis and potentially indicating a change in the anticipated market direction.
In summary, the GBPJPY Elliott Wave Analysis for the daily chart on 16 January 24, suggests that the market is currently within a corrective phase (Black wave C of 4), with a potential start of the next impulsive wave (Blue wave 5). Traders are advised to monitor the progression of the correction and consider the invalidation level at 188.680.
Technical Analyst: Malik Awais
Source: Tradinglounge.com get trial here!