Elliott Wave Analysis for NextEra Energy Inc. (NEE)

This Elliott Wave analysis for NextEra Energy Inc. (NEE) offers a detailed examination of the stock's price movements using the Elliott Wave Theory. The analysis aims to assist traders in identifying potential trading opportunities based on the current market behavior. Insights are derived from both daily and 4-hour charts to provide a comprehensive understanding of NEE's price action.

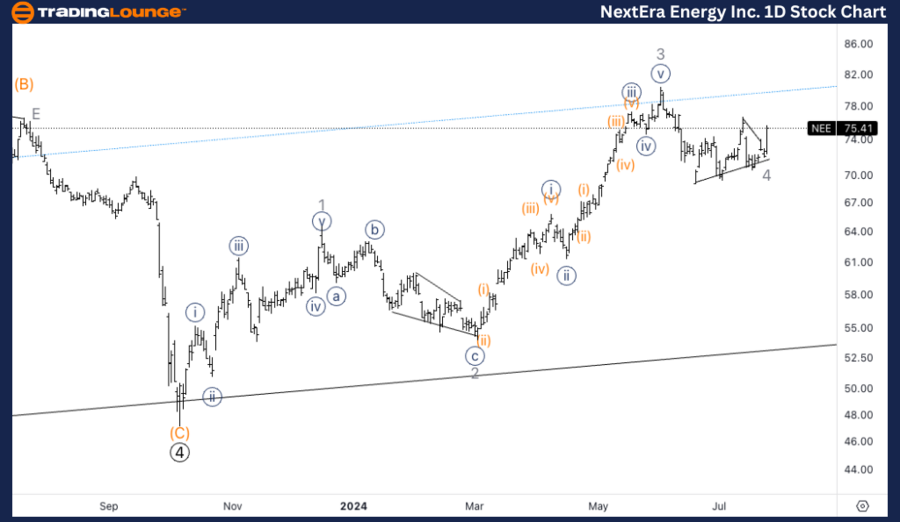
NEE Elliott Wave Analysis - Daily Chart

NextEra Energy Inc. (NEE) Daily Chart Analysis

NEE Elliott Wave Technical Analysis

Function: Counter Trend

Mode: Corrective

Structure: Flat

Position: Minor wave 4

Direction: Bottom at wave 4.

Details: The analysis suggests a minor wave 4 formation with support around $72.

NEE Elliott Wave Technical Analysis – Daily Chart

The daily chart analysis indicates that Minor wave 4 has likely established support near the $72 level. This level is crucial as it may signify the end of the corrective phase, potentially leading to the next upward movement. Traders should closely monitor this support level to confirm the bottom's formation.

NextEra-Energy-Inc-1...


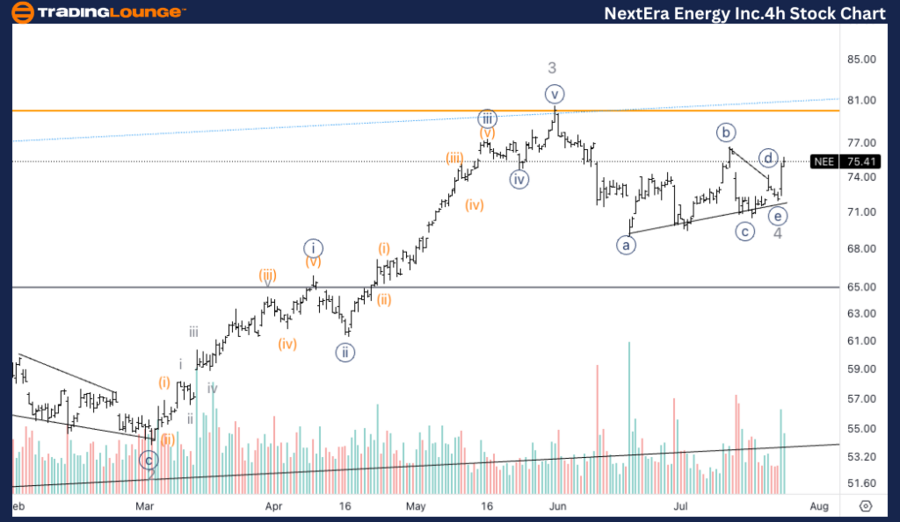
NEE Elliott Wave Analysis - 4-Hour Chart

NextEra Energy Inc. (NEE) 4H Chart Analysis

NEE Elliott Wave Technical Analysis

Function: Counter Trend

Mode: Corrective

Structure: Flat

Position: Minor wave 4

Direction: Bottom at wave 4.

Details: The 4-hour chart suggests a possible triangle formation in wave 4, indicating a bottoming process and the potential start of an upward movement.

NEE Technical Analysis – 4H Chart

The 4-hour chart provides a more detailed view of the wave 4 subdivision, indicating a potential triangle formation. This pattern suggests that wave 4 might have reached its bottom, and an upward trend could be emerging. Traders should look for a breakout from this triangle to confirm the continuation of the upward movement.

Technical Analyst: Alessio Barretta

Source: visit Tradinglounge.com and learn From the Experts Join TradingLounge Here 

See Previous: Eaton Corp PLC (ETN) Elliott Wave Technical Analysis

Special Trial Offer - 0.76 Cents a Day for 3 Months! Click here

Access 7 Analysts Over 170 Markets Covered. Chat Room With Support

NextEra-Energy-Inc-4...

Related

ASX: GOODMAN GROUP (GMG) Elliott Wave Technical Analysis – Invalidation Points, and Actionable Stock Market Insights

ASX: GOODMAN GROUP (GMG) Elliott Wave Technical Analysis – Invalidation Points, and Actionable Stock Market Insights

Elliott Wave analysis for ASX: GOODMAN GROUP (GMG) reports examine wave (iv)-orange trends, key vali...

Read More >
Elliott Wave Analysis for Dogecoin (DOGEUSD): Short-Term Price Forecast, Trade Strategy, Wave 3 Setup & Resistance Insights

Elliott Wave Analysis for Dogecoin (DOGEUSD): Short-Term Price Forecast, Trade Strategy, Wave 3 Setup & Resistance Insights

Elliott Wave analysis for Dogecoin (DOGEUSD), detailing the current impulsive wave structure, predic...

Read More >
Actionable Forex Trading Strategies for Euro/U.S. Dollar Using EURUSD Elliott Wave Technical Analysis With Chart Insight

Actionable Forex Trading Strategies for Euro/U.S. Dollar Using EURUSD Elliott Wave Technical Analysis With Chart Insight

This comprehensive analysis covers the EURUSD Elliott Wave structure on both daily and 4-hour charts...

Read More >
Elliott Wave Analysis of ASX: RMD ResMed Inc. Stock Performance, Financial Trends and Investment Opportunities

Elliott Wave Analysis of ASX: RMD ResMed Inc. Stock Performance, Financial Trends and Investment Opportunities

ResMed Inc. (ASX: RMD) stock performance, including price analysis, financials, dividend insights, a...

Read More >
U.S.Dollar/Japanese Yen(USDJPY) Forex Elliott Wave Technical Analysis: Impulsive Trends and Key Levels to Watch

U.S.Dollar/Japanese Yen(USDJPY) Forex Elliott Wave Technical Analysis: Impulsive Trends and Key Levels to Watch

Elliott Wave analysis of the USDJPY currency pair highlights the current trend, explains the impulsi...

Read More >

$1 for 2 Weeks

then $29 a month!

What a Special Offer!

Trade Recommendations

Unleash the power of deversified trading with our comprehensive portfolio, covering 250+ markets:

  • Stock Trades
  • Crypto Trades
  • Forex Trades
  • Commodity Trades
Elliott Wave Analysis

Gain a competitive edge with expert insights and AI-powered Elliott Wave charting into:

  • Global Indices
  • US Stocks & ASX Stocks
  • Forex & Crypto
  • Commodities
Top-Notch Trading Tools

Equip yourself with the tools of success:

  • Real-time Chat rooms
  • Elliott Wave Algorithm
  • Portfolio tools
  • TradingLevels
  • Screener
  • Trading Game
7 Elliott Wave Analysts

Stay ahead of the market with daily charts and insightful videos
Your secret to strategic trading!

JOIN HERE


Welcome to TradingLounge (ASIC A.R.No. 321187), specialists in trades, trading education and technical analysis, covering stocks, indices, commodities, forex and cryptocurrencies.

When you join TradingLounge you have access to everything we offer, including trade tools, educational content and a social platform to chat with like-minded investors.

Read more

@Copyright 2024 by tradinglounge.com

Contact Us

Australian no: 02 4787 6020

International no: +61 (2) 47876020

Pay with:

Find us on