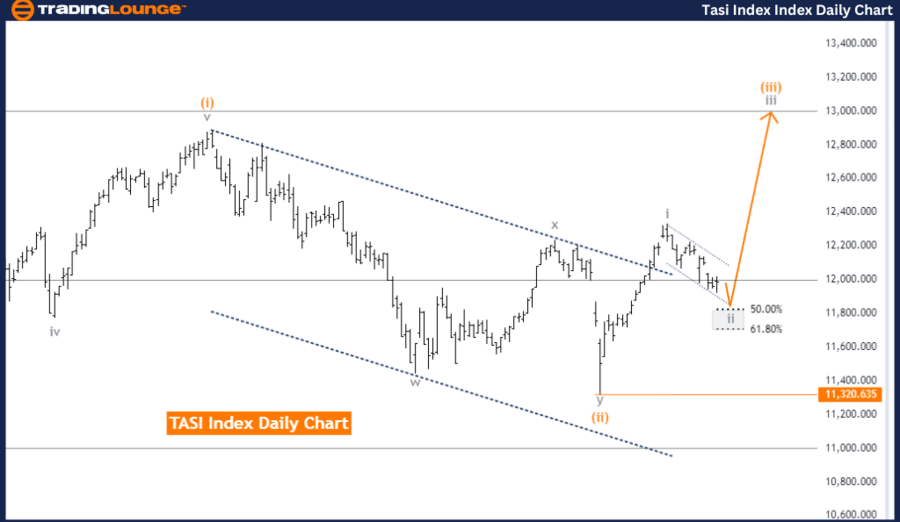
TASI Index Elliott Wave Analysis Trading Lounge Day Chart
TASI Index Elliott Wave Technical Analysis
-
Function: Counter Trend
-
Mode: Corrective
-
Structure: Gray Wave 2
-
Position: Orange Wave 3
-
Direction (Next Higher Degrees): Gray Wave 3
-
Details: Gray wave 1 completed, gray wave 2 is currently in play and nearing its end.
- Wave Cancel Invalid Level: 11320.635
The TASI Index Elliott Wave analysis for the day chart reveals a counter-trend movement within a corrective phase. The current wave under observation is gray wave 2, which follows the completed gray wave 1. Based on the analysis, gray wave 2 is ongoing and is expected to conclude soon, signaling that the corrective phase may be nearing its completion.
This analysis mode is corrective, indicating that the market is experiencing a pullback or consolidation following the impulsive movement seen in gray wave 1. The next anticipated move in a higher degree is gray wave 3, suggesting a possible shift from the current corrective trend to a new impulsive upward movement. Once gray wave 2 completes, the market may transition into a more bullish phase with the onset of gray wave 3.
The wave cancel invalid level is set at 11320.635, meaning if the price surpasses this point, the current wave count will be invalidated, requiring adjustments. At present, the analysis suggests that the corrective phase is almost over, and a reversal or continuation of the trend may happen soon.
Summary: The TASI Index is in a corrective phase with gray wave 2 progressing and expected to end shortly. After this, the market may shift to a more bullish trend with gray wave 3. The current wave count remains valid as long as the price stays below 11320.635.
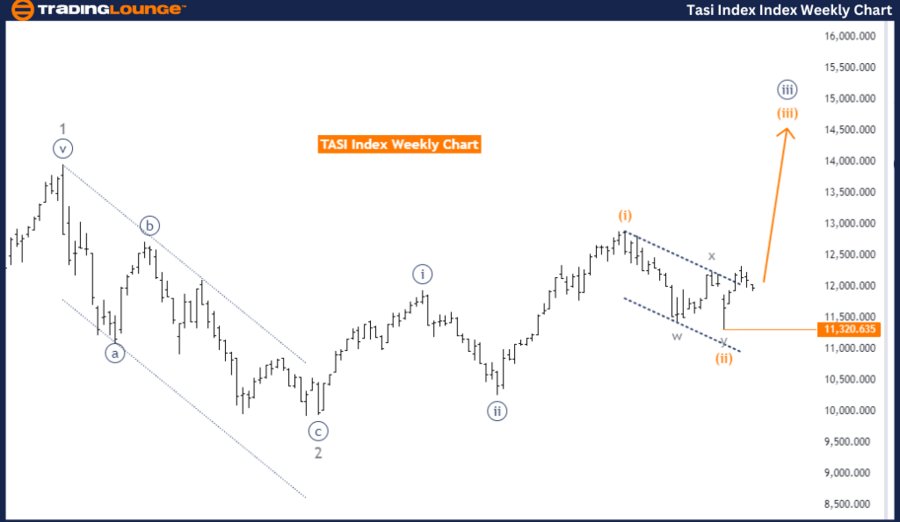
TASI Index Elliott Wave Analysis Trading Lounge Weekly Chart
TASI Index Elliott Wave Technical Analysis
-
Function: Bullish Trend
-
Mode: Impulsive
-
Structure: Orange Wave 3 (Started)
-
Position: Navy Blue Wave 3
-
Direction (Next Lower Degrees): Orange Wave 4
-
Details: Orange wave 2 completed, orange wave 3 is currently in play.
- Wave Cancel Invalid Level: 11320.635
The TASI Index Elliott Wave analysis for the weekly chart shows a strong bullish trend marked by an impulsive movement. The current wave under observation is orange wave 3, which started after the completion of orange wave 2. The market is positioned in navy blue wave 3, part of the larger orange wave 3 structure.
This analysis points to a continuation of the upward momentum, confirming a bullish trend. Orange wave 3 is expected to drive the market higher, in line with the impulsive nature of this phase. After the completion of orange wave 3, the next phase will be orange wave 4, initiating a corrective phase. For now, however, the bullish trend remains intact as the market moves through orange wave 3.
The next lower degree wave, orange wave 4, is expected to follow the current impulsive phase, leading to a corrective movement. However, as long as the market is in orange wave 3, the bullish outlook remains strong.
The wave cancel invalid level is set at 11320.635. If the price falls to this level, the current wave count would be invalidated, and the analysis will need to be revised. As long as the price stays above this level, the existing wave structure holds, and the bullish trend is expected to continue.
Summary: The TASI Index is in a bullish trend, with orange wave 3 in progress after the completion of orange wave 2. The market is expected to maintain its upward movement, and the analysis remains valid as long as the price stays above 11320.635. Once the impulsive phase concludes, orange wave 4 will start, signaling the beginning of a corrective phase.
Technical Analyst: Malik Awais
Source: visit Tradinglounge.com and learn From the Experts Join TradingLounge Here
Previous: KOSPI Composite index Elliott Wave Technical Analysis
Special Trial Offer - 0.76 Cents a Day for 3 Months! Click here
Access 7 Analysts Over 200 Markets Covered. Chat Room With Support