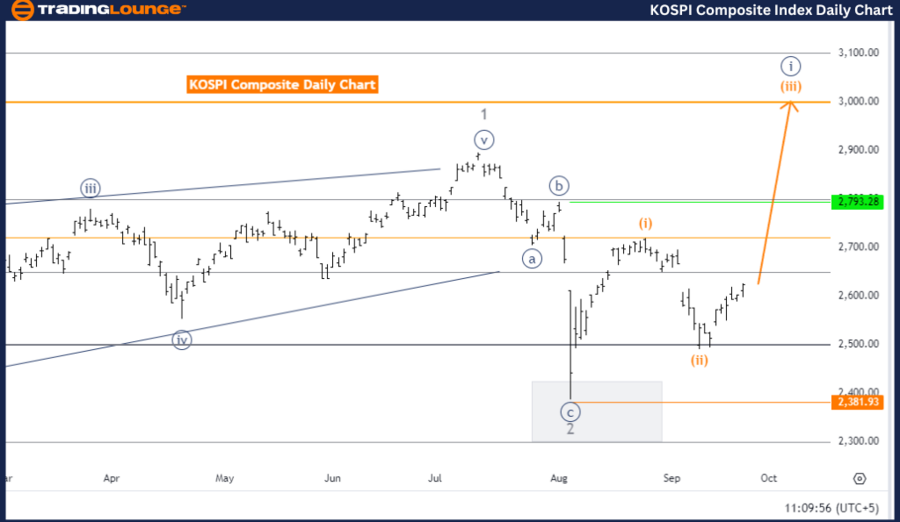
KOSPI Composite Elliott Wave Analysis – Trading Lounge Day Chart

KOSPI Composite Elliott Wave Technical Analysis

Function: Trend

Mode: Impulsive

Structure: Orange wave 3

Position: Navy blue wave 1

Next Lower Degrees Direction: Orange wave 4

Invalidation Level: 2381.93

The daily KOSPI Composite Elliott Wave analysis points to a developing trend with impulsive momentum. The current wave structure highlights orange wave 3, signaling a strong upward movement, characteristic of a third wave in a five-wave Elliott Wave sequence. This wave is positioned within navy blue wave 1.

Key Observations:

  • Orange wave 2 (the corrective phase) appears to have completed.
  • Orange wave 3 is now active, pushing the market higher. As a third wave, it typically generates the most powerful gains in an impulsive wave cycle.
  • Orange wave 4 is expected to follow, representing the next corrective phase after the completion of orange wave 3.
  • A pullback in wave 4 may occur before the continuation of an upward trend in wave 5.
  • If the price falls below 2381.93, the current wave structure becomes invalid, potentially altering the bullish forecast.

Summary:

The daily KOSPI Composite chart indicates a robust upward trend driven by orange wave 3, following the completion of the corrective orange wave 2. As long as the price stays above the 2381.93 level, the Elliott Wave structure remains valid. A corrective phase in wave 4 is expected after wave 3 completes, with the bullish trend likely to resume in wave 5.

KOSPI-Composite-Inde...


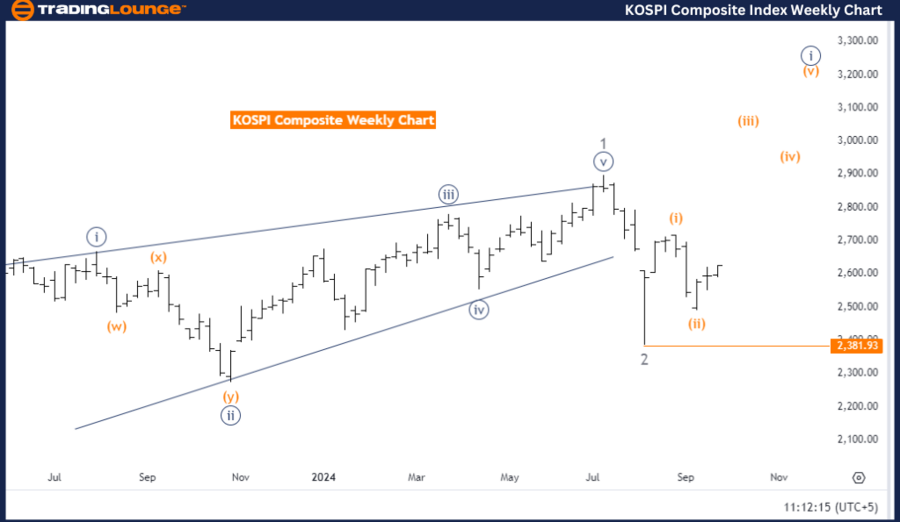
KOSPI Composite Elliott Wave Analysis – Trading Lounge Weekly Chart

KOSPI Composite Elliott Wave Technical Analysis

Function: Trend

Mode: Impulsive

Structure: Orange wave 3

Position: Navy blue wave 1

Next Lower Degrees Direction: Orange wave 4

Invalidation Level: 2381.93

The weekly KOSPI Composite Elliott Wave analysis reveals a strong bullish trend, following an impulsive wave structure. The current wave, orange wave 3, highlights a phase of upward momentum, typical of the strongest part of the Elliott Wave cycle. This wave is positioned within navy blue wave 1, indicating that the trend is still in its early stages.

Key Observations:

  • Orange wave 2, a corrective phase, appears to be completed.
  • Orange wave 3 is now in progress, propelling the market higher with strong bullish momentum.
  • Orange wave 4 is expected as the next phase, likely introducing a brief correction after wave 3 concludes. This correction could lead to continued upward movement in wave 5.
  • The wave structure holds as long as the price remains above the invalidation level of 2381.93. A price drop below this level would invalidate the current Elliott Wave count and suggest a possible trend reversal.

Summary:

The KOSPI Composite weekly chart demonstrates a continuing upward trend, driven by the strength of orange wave 3 after the completion of the corrective orange wave 2. As long as the price remains above 2381.93, the bullish outlook persists. A minor correction in orange wave 4 is expected after wave 3 completes, followed by a continuation of the upward trend in wave 5.

Technical Analyst: Malik Awais

Source: visit Tradinglounge.com and learn From the Experts Join TradingLounge Here 

Previous: NASDAQ Index Elliott Wave Technical Analysis

VALUE Offer - Buy 1 Month & Get 3 Months!Click here

Access 7 Analysts Over 200 Markets Covered. Chat Room With Support

KOSPI-Composite-Inde...

Related

DOW JONES – DJI Index Elliott Wave Forecast Shows Bullish Trend with Wave Count Analysis and Key Invalidation Level at 36,642

DOW JONES – DJI Index Elliott Wave Forecast Shows Bullish Trend with Wave Count Analysis and Key Invalidation Level at 36,642

Dow Jones analysis applies Elliott Wave Theory to identify a strong bullish trend, with active impul...

Read More >
National Australia Bank Limited Stock Analysis - NAB Elliott Wave Technical Forecast and Trading Strategies

National Australia Bank Limited Stock Analysis - NAB Elliott Wave Technical Forecast and Trading Strategies

This article provides an in-depth Elliott Wave analysis of NAB (National Australia Bank) stock on th...

Read More >
Costco Wholesale Corp.(COST:NASDAQ) Elliott Wave Technical Analysis 10 January 24

Costco Wholesale Corp.(COST:NASDAQ) Elliott Wave Technical Analysis 10 January 24

Costco Wholesale Corp.(COST: NASDAQ) Elliott Wave Technical Analysis Dated 10 January 24 with 4-Hour...

Read More >
Unlock AUDUSD's Bullish Potential: In-Depth Australian Dollar/U.S. Dollar Elliott Wave Analysis & Expert Trading Strategy

Unlock AUDUSD's Bullish Potential: In-Depth Australian Dollar/U.S. Dollar Elliott Wave Analysis & Expert Trading Strategy

Get the most recent AUDUSD Elliott Wave analysis with insights into the bullish trend and wave struc...

Read More >
Bitcoin Crypto Price Analysis: Today BTCUSD Elliott Wave Technical Analysis and bullish trend forecasts

Bitcoin Crypto Price Analysis: Today BTCUSD Elliott Wave Technical Analysis and bullish trend forecasts

Get the latest BTCUSD analysis and Bitcoin Elliott Wave technical insights. Our detailed BTCUSD trad...

Read More >
In-Depth Analysis breaks down the Uniswap Crypto UNIUSD Elliott Wave Technical Analysis and Price Movements

In-Depth Analysis breaks down the Uniswap Crypto UNIUSD Elliott Wave Technical Analysis and Price Movements

This article provides an in-depth Elliott Wave Uniswap (UNIUSD) analysis, focusing on the latest pri...

Read More >

$1 for 2 Weeks

then $29 a month!

What a Special Offer!

Trade Recommendations

Unleash the power of deversified trading with our comprehensive portfolio, covering 250+ markets:

  • Stock Trades
  • Crypto Trades
  • Forex Trades
  • Commodity Trades
Elliott Wave Analysis

Gain a competitive edge with expert insights and AI-powered Elliott Wave charting into:

  • Global Indices
  • US Stocks & ASX Stocks
  • Forex & Crypto
  • Commodities
Top-Notch Trading Tools

Equip yourself with the tools of success:

  • Real-time Chat rooms
  • Elliott Wave Algorithm
  • Portfolio tools
  • TradingLevels
  • Screener
  • Trading Game
7 Elliott Wave Analysts

Stay ahead of the market with daily charts and insightful videos
Your secret to strategic trading!

JOIN HERE


Welcome to TradingLounge (ASIC A.R.No. 321187), specialists in trades, trading education and technical analysis, covering stocks, indices, commodities, forex and cryptocurrencies.

When you join TradingLounge you have access to everything we offer, including trade tools, educational content and a social platform to chat with like-minded investors.

Read more

@Copyright 2024 by tradinglounge.com

Contact Us

Australian no: 02 4787 6020

International no: +61 (2) 47876020

Pay with:

Find us on