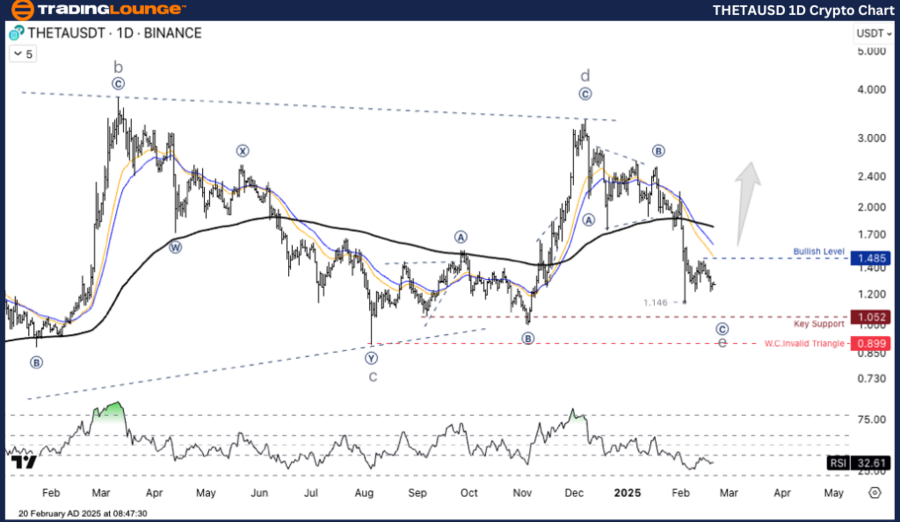
THETAUSD Elliott Wave Analysis – TradingLounge Daily Chart

THETA/USD (THETAUSDT) Price Forecast

THETAUSD Elliott Wave Technical Analysis

  • Function: Counter-trend
  • Mode: Corrective
  • Structure: Zigzag
  • Position: Wave ((C))
  • Next Higher Degree Direction: Wave E of Triangle
  • Wave Invalidation Level:

Analysis: THETAUSDT is nearing the final phase of the ABCDE Triangle Pattern. A decisive breakout above 1.485 USD could confirm a potential bullish trend continuation.

THETA/USD (THETAUSDT) Trading Strategy

The current ABC Zigzag Correction structure suggests Wave E of the Triangle Formation is in progress. This phase is close to completion and may test the 1.052 USDT support level before making a directional move.

THETAUSDT Trading Strategies:

📈 Long Strategy:

  • Entry Option 1: Buy at 1.052 USDT if a strong reversal signal appears.

  • Entry Option 2: Buy upon breakout above 1.485 USD, confirming an uptrend with increased trading volume.

Risk Management:

  • Stop Loss: Exit if the price drops below 0.899 USDT to minimize risk.

THETAUSD-1D-Crypto-C...


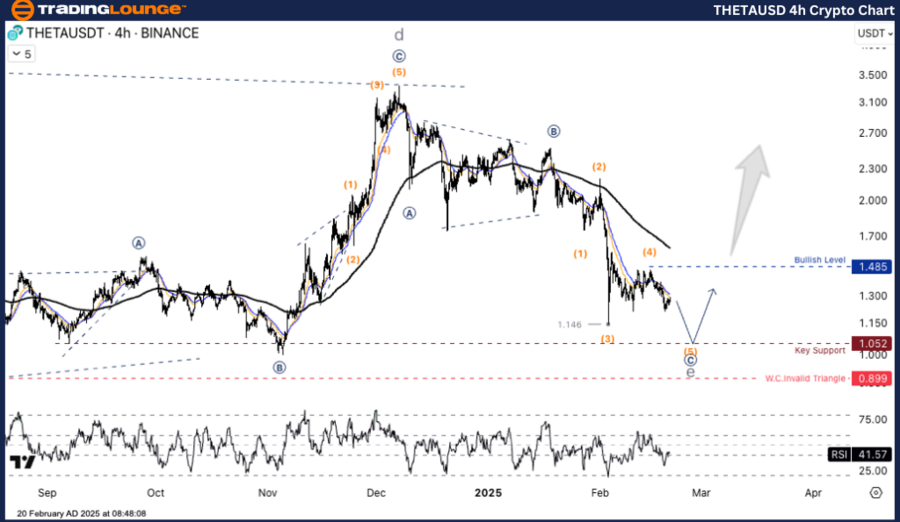
THETAUSD Elliott Wave Analysis – TradingLounge H4 Chart

THETA/USD (THETAUSDT) Price Outlook

THETAUSD Elliott Wave Technical Analysis

  • Function: Counter-trend

  • Mode: Corrective

  • Structure: Zigzag

  • Position: Wave ((C))

  • Next Higher Degree Direction: Wave E of Triangle

  • Wave Invalidation Level:

Analysis: THETAUSDT continues to consolidate within the ABCDE Triangle Pattern, nearing the completion phase. A breakout above 1.485 USD could trigger a bullish continuation.

THETA/USD (THETAUSDT) Trading Strategy

The ABC Zigzag Correction is shaping Wave E of the Triangle, signaling a potential reversal. The price is stabilizing near 1.052 USDT, which could serve as a key support zone before an upward move.

Trading Strategies:

📈 Long Strategy:

  • Entry Option 1: Buy on a rebound from 1.052 USDT if a clear reversal signal is detected.
  • Entry Option 2: Buy after a confirmed breakout above 1.485 USD, backed by high volume.

Risk Management:

  • Stop Loss: Exit if the price falls below 0.899 USDT to manage downside risk.

Technical Analyst: Kittiampon SomboonsodCEWA

Source: visit Tradinglounge.com and learn From the Experts Join TradingLounge Here 

Previous: BNBUSD Elliott Wave Technical Analysis

VALUE Offer - Buy 1 Month & Get 3 Months!Click here

Access 7 Analysts Over 200 Markets Covered. Chat Room With Support

THETAUSD-4h-Crypto-C...

Related

Ethereum/ U.S. dollar(ETHUSD) Elliott Wave Technical Analysis: Potential Upside Moves in Ethereum's Uptrend

Ethereum/ U.S. dollar(ETHUSD) Elliott Wave Technical Analysis: Potential Upside Moves in Ethereum's Uptrend

This post provides detailed Elliott Wave analysis for Ethereum against the US dollar (ETHUSD), focus...

Read More >
Showcasing Bullish Trend Insights and Forecast - U.S. Dollar / Japanese Yen (USDJPY) Forex Elliott Wave Technical Analysis

Showcasing Bullish Trend Insights and Forecast - U.S. Dollar / Japanese Yen (USDJPY) Forex Elliott Wave Technical Analysis

This article provides an in-depth USDJPY Elliott Wave analysis, showcasing bullish trends and key wa...

Read More >
HDFC Life Insurance’s Stocks Forecast  And Elliott Wave Technical Analysis - Price Movements and Projected Resistance Levels

HDFC Life Insurance’s Stocks Forecast And Elliott Wave Technical Analysis - Price Movements and Projected Resistance Levels

This in-depth analysis covers HDFC Life Insurance’s stock forecast using Elliott Wave theory, highl...

Read More >
Elliott Wave Analysis: S&P 500, NASDAQ 100, DAX 40, FTSE 100, ASX 200

Elliott Wave Analysis: S&P 500, NASDAQ 100, DAX 40, FTSE 100, ASX 200

Elliott Wave Analysis: Covering S&P 500, NASDAQ 100, DAX 40, FTSE 100, and ASX 200. 🔥 Special ...

Read More >
The Walt Disney Co. (DIS) Stock Forecast: Elliott Wave Technical Analysis and Key Price Levels for 2024

The Walt Disney Co. (DIS) Stock Forecast: Elliott Wave Technical Analysis and Key Price Levels for 2024

This article provides an in-depth Elliott Wave analysis of The Walt Disney Co. (DIS) stock, includin...

Read More >
Insightful Day and 4-Hour Chart Review: British Pound/Japanese Yen(GBPJPY) Forex Elliott Wave Technical Analysis

Insightful Day and 4-Hour Chart Review: British Pound/Japanese Yen(GBPJPY) Forex Elliott Wave Technical Analysis

This comprehensive guide offers detailed GBPJPY trading analysis, focusing on Elliott Wave forecasts...

Read More >

$1 for 2 Weeks

then $29 a month!

What a Special Offer!

Trade Recommendations

Unleash the power of deversified trading with our comprehensive portfolio, covering 250+ markets:

  • Stock Trades
  • Crypto Trades
  • Forex Trades
  • Commodity Trades
Elliott Wave Analysis

Gain a competitive edge with expert insights and AI-powered Elliott Wave charting into:

  • Global Indices
  • US Stocks & ASX Stocks
  • Forex & Crypto
  • Commodities
Top-Notch Trading Tools

Equip yourself with the tools of success:

  • Real-time Chat rooms
  • Elliott Wave Algorithm
  • Portfolio tools
  • TradingLevels
  • Screener
  • Trading Game
7 Elliott Wave Analysts

Stay ahead of the market with daily charts and insightful videos
Your secret to strategic trading!

JOIN HERE


Welcome to TradingLounge (ASIC A.R.No. 321187), specialists in trades, trading education and technical analysis, covering stocks, indices, commodities, forex and cryptocurrencies.

When you join TradingLounge you have access to everything we offer, including trade tools, educational content and a social platform to chat with like-minded investors.

Read more

@Copyright 2024 by tradinglounge.com

Contact Us

Australian no: 02 4787 6020

International no: +61 (2) 47876020

Pay with:

Find us on