In this ETHUSD Elliott Wave Technical Analysis for February 23, we delve into Ethereum's current market dynamics, employing Elliott Wave theory to forecast potential price movements. With a focus on both daily and 4-hour charts, we aim to provide valuable insights for traders seeking to navigate the cryptocurrency market.
Elliott Wave Analysis TradingLounge Daily Chart, 23 February 24,
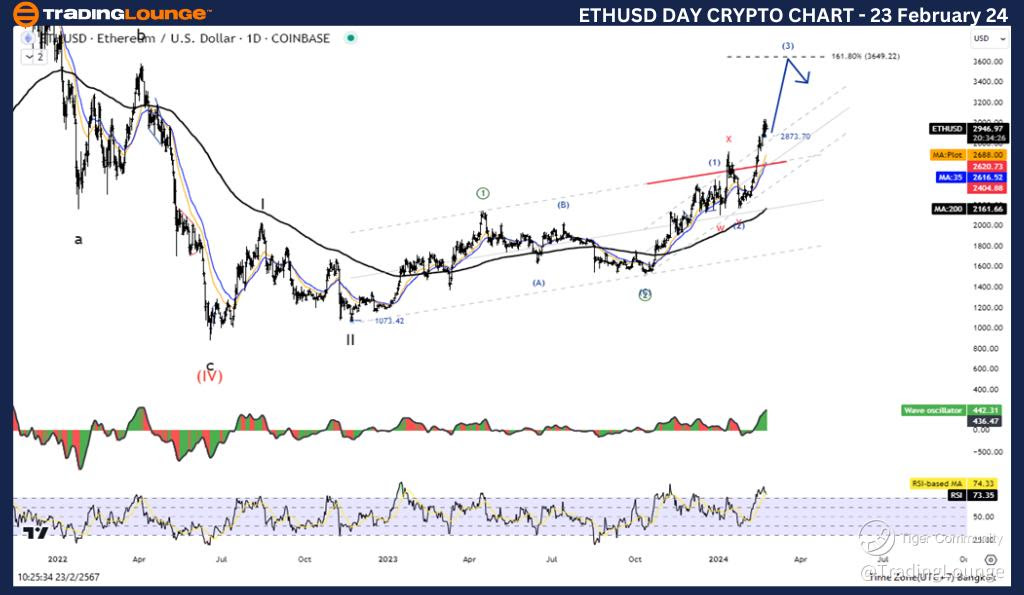
ETHUSD Elliott Wave Technical Analysis - Daily Chart: Ethereum continues its upward trajectory within the Elliott Wave framework, with the current wave identified as part of the Impulse structure. As of now, Ethereum is positioned within Wave (3), indicating further bullish sentiment. However, it's essential to note that two more moves are required to complete this pattern, suggesting potential upside opportunities.
Ethereum/ U.S. dollar(ETHUSD)Trading Strategy: Ethereum overall is still in an uptrend. Currently, on the rise of the Impulse Wave, we are still missing two more moves to complete the pattern.
ETHUSD Technical indicators support this analysis, with the price comfortably above the MA200, signaling an uptrend. Additionally, Wave Oscillators reflect a bullish momentum, further reinforcing the positive outlook for Ethereum against the US dollar.
TradingLounge Analyst: Kittiampon Somboonsod, CEWA

Elliott Wave Analysis TradingLounge 4Hr Chart, 23 February 24,
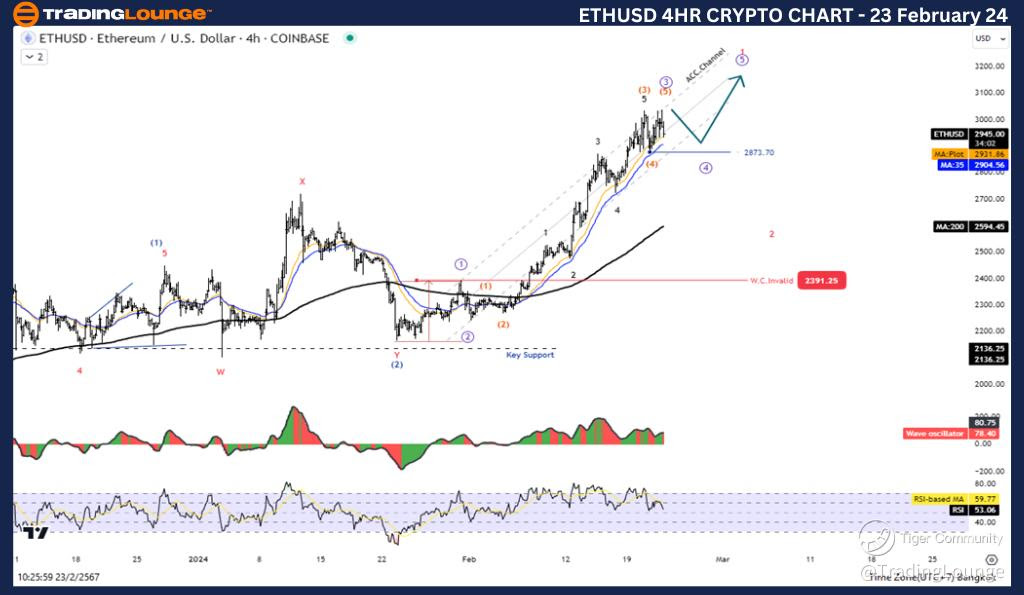
ETHUSD Elliott Wave Technical Analysis - 4-Hour Chart: Zooming into the 4-hour chart, Ethereum's upward momentum remains intact, aligning with the Impulse structure. Currently designated as Wave ((5)), Ethereum exhibits characteristics indicative of a motive wave, suggesting continued bullish momentum.
Similar to the daily chart analysis, Ethereum's uptrend is supported by technical indicators. The price remains above the MA200, underscoring the prevailing bullish sentiment. Additionally, Wave Oscillators indicate a bullish momentum trend, bolstering confidence in Ethereum's upward trajectory.
TradingLounge Analyst: Kittiampon Somboonsod, CEWA
Source: visit Tradinglounge.com and learn From the Experts Join TradingLounge Here
See Previous: ChainLink/U.S. Dollar (LINKUSD)

Conclusion: In conclusion, Ethereum's price action against the US dollar remains firmly within an uptrend, as per Elliott Wave's analysis. Both daily and 4-hour charts indicate the presence of Impulse structures, with Wave (3) and Wave ((5)) in focus, respectively. Traders are advised to monitor Ethereum's price movements closely, as potential upside moves could materialize with the completion of the Elliott Wave patterns.
With technical indicators signaling bullish momentum and the overall uptrend intact, Ethereum presents opportunities for traders seeking to capitalize on market movements. As always, it's essential to conduct thorough risk management and stay informed of market developments when executing trading strategies in the cryptocurrency space.