Elliott Wave Analysis TradingLounge Daily Chart 

In the dynamic world of cryptocurrency trading, understanding market patterns is crucial for success. This guide delves into the Elliott Wave analysis of NEO against the U.S. dollar (NEOUSD), providing traders with insights to navigate the complexities of market trends effectively.

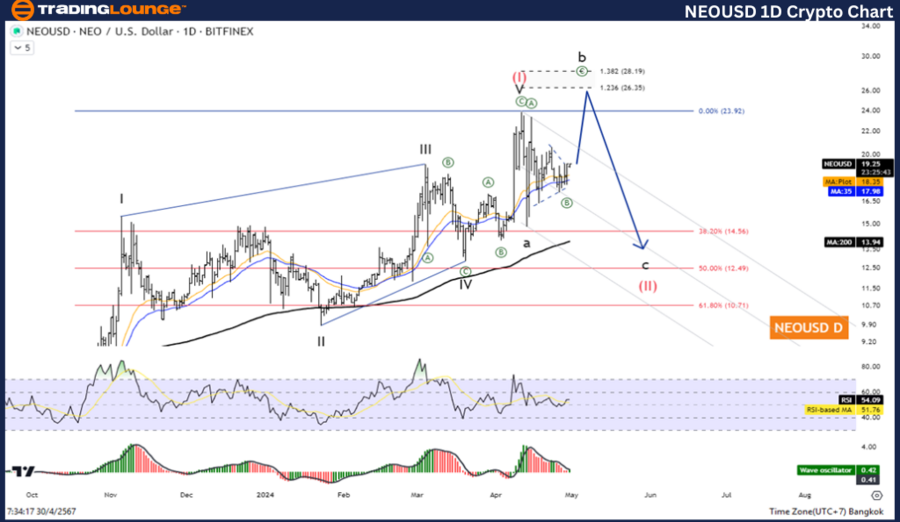
NEO/ U.S. dollar(NEOUSD) Daily Chart Analysis

NEOUSD Elliott Wave Technical Analysis

Function: Counter Trend

Mode: Corrective

Structure: Flat

Position: Wave B

Direction Next higher Degrees: Wave (II) of Impulse

Wave Cancel invalid Level: 9.85

Details: Wave (II) is equal to 61.8% of Wave (I) at 10.71 Level

NEO/ U.S. dollar(NEOUSD)Trading Strategy:
Second wave correction before rising again in the third wave with a flat pattern. The current status is a short-term pullback in wave B before falling again in wave C, so wait for the correction to complete to join the uptrend again.

NEO/ U.S. dollar(NEOUSD)Technical Indicators: The price is above the MA200 indicating an Uptrend, The Wave Oscillator is a Bullish Momentum.

NEOUSD-1D-crypto-cha...


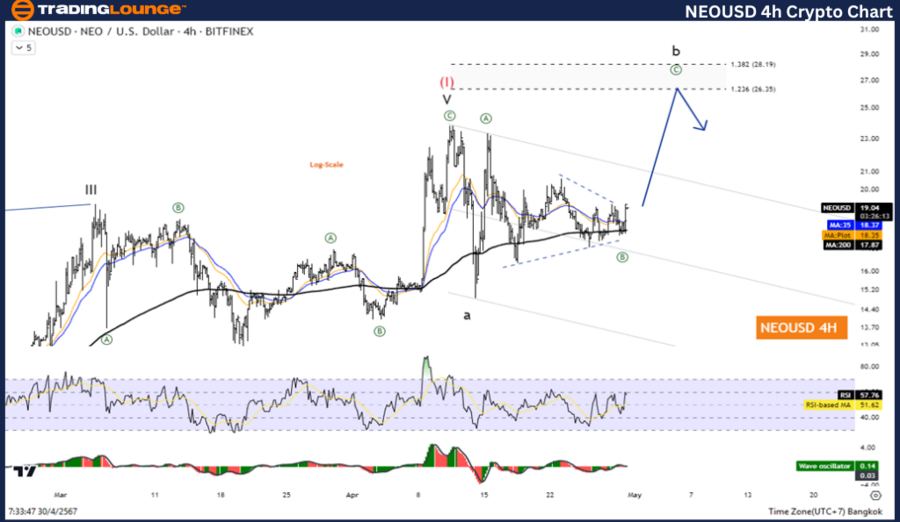
Elliott Wave Analysis TradingLounge H4 Chart 

NEO/ U.S. dollar(NEOUSD) 4-Hour Chart Analysis

NEOUSD Elliott Wave Technical Analysis

Function: Counter Trend

Mode: Corrective

Structure: Flat

Position: Wave B

Direction Next higher Degrees: Wave (II) of Impulse

Wave Cancel invalid Level: 9.85

Details: Wave (II) is equal to 61.8% of Wave (I) at 10.71 Level


NEO/ U.S. dollar(NEOUSD)Trading Strategy:
Second wave correction before rising again in the third wave with a flat pattern. The current status is a short-term pullback in wave B before falling again in wave C, so wait for the correction to complete to join the uptrend again.

NEO/ U.S. dollar(NEOUSD)Technical Indicators: The price is above the MA200 indicating an uptrend, The Wave Oscillator is a Bullish Momentum.

Technical Analyst: Kittiampon Somboonsod

Source: visit Tradinglounge.com and learn From the Experts Join TradingLounge Here 

Previous: Binance/ U.S. dollar(BNBUSD) Elliott Wave Technical Analysis

Special Trial Offer - 0.76 Cents a Day for 3 Months! Click here

Access 6 Analysts covering over 150 Markets. Chat Room With Support

NEOUSD-4hr-crypto-ch...

Conclusion

The Elliott Wave analysis for NEOUSD highlights a complex yet predictable pattern of market behavior, where understanding specific wave structures can significantly benefit trading strategies. The current corrective phase in the market presents a strategic opportunity for investors to engage just as the market readies itself for another upward move.

Related

WESTPAC BANKING CORPORATION- Learn how to leverage these WBC Stock Analysis & Elliott Wave Technical Forecast

WESTPAC BANKING CORPORATION- Learn how to leverage these WBC Stock Analysis & Elliott Wave Technical Forecast

Explore the comprehensive Elliott Wave analysis for ASX: WESTPAC BANKING CORPORATION (WBC). Our deta...

Read More >
U.S. Dollar / Japanese Yen (USDJPY) Elliott Wave Analysis: Daily & 4-Hour Chart Insights on Corrective Phases and Bullish Trends

U.S. Dollar / Japanese Yen (USDJPY) Elliott Wave Analysis: Daily & 4-Hour Chart Insights on Corrective Phases and Bullish Trends

USDJPY Elliott Wave Analysis offers an in-depth look at the daily and 4-hour charts. The report pred...

Read More >
DOW JONES (DJI) Index Elliott Wave Technical Analysis: Focusing on impulsive movements and critical wave structures

DOW JONES (DJI) Index Elliott Wave Technical Analysis: Focusing on impulsive movements and critical wave structures

The DOW JONES DJI Elliott Wave Analysis provides an in-depth look at the current market trends using...

Read More >
Amazon Inc. (AMZN) Elliott Wave Analysis: Amazon Stock Forecast, Market Trends, Trading Strategies, and Investment Insights

Amazon Inc. (AMZN) Elliott Wave Analysis: Amazon Stock Forecast, Market Trends, Trading Strategies, and Investment Insights

Elliott Wave analysis of Amazon (AMZN) stock, including insights into current market trends, wave pa...

Read More >
KOSPI Composite Index Elliott Wave Technical Analysis: Indicates a Strong Bullish Trend with Significant Investment Potential

KOSPI Composite Index Elliott Wave Technical Analysis: Indicates a Strong Bullish Trend with Significant Investment Potential

The latest Elliott Wave analysis on the KOSPI Composite Index indicates a strong bullish trend with ...

Read More >

Buy 1 Month

Get 3 Months!

Special Offer:

Trade Recommendations

Unleash the power of deversified trading with our comprehensive portfolio, covering:

  • Stock Trades
  • Crypto Trades
  • Forex Trades
  • Commodity Trades
Elliott Wave Analysis

Gain a competive edge with expert insights in to:

  • Global Indices
  • US Stocks & ASX Stocks
  • Forex & Crypto
  • Commodities
Top-Notch Trading Tools

Equip yourself with the tools of success:

  • Social Chat
  • Elliott Wave Algorithm
  • Screener
  • TradingLevels
  • Trading Game
7 Elliott Wave Analysts

Stay ahead of the market with daily charts and insightful videos
-Your secret to strategic trading!

JOIN HERE


Welcome to TradingLounge (ASIC A.R.No. 321187), specialists in trades, trading education and technical analysis, covering stocks, indices, commodities, forex and cryptocurrencies.

When you join TradingLounge you have access to everything we offer, including trade tools, educational content and a social platform to chat with like-minded investors.

Read more

@Copyright 2024 by tradinglounge.com

Contact Us

Australian no: 02 4787 6020

International no: +61 (2) 47876020

Pay with:

Find us on