EURUSD Elliott Wave Analysis | Trading Lounge Daily Chart
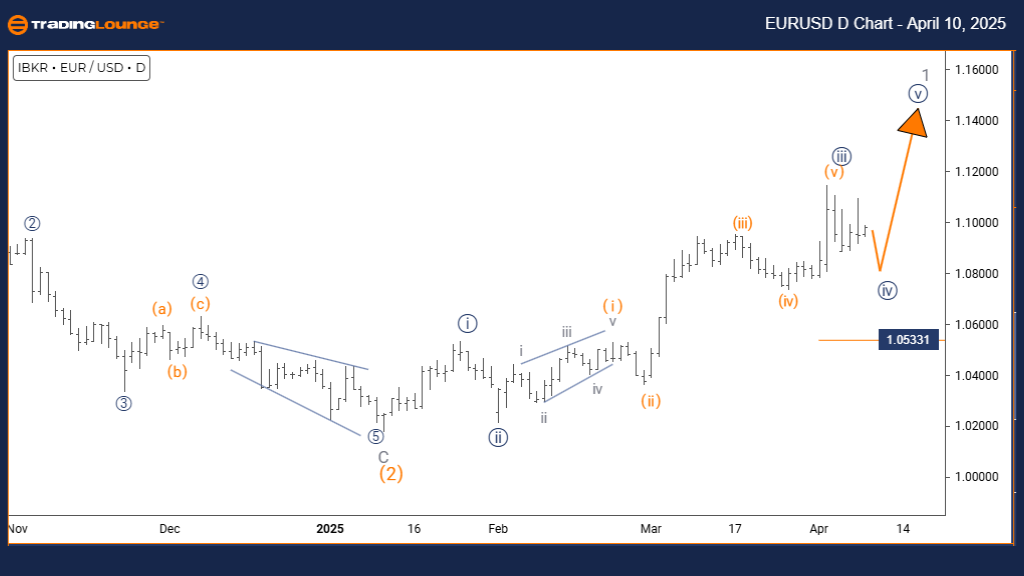
Euro/ U.S. Dollar (EURUSD) Daily Chart Analysis
EURUSD Elliott Wave Technical Forecast
FUNCTION: Counter-Trend
MOD: Corrective
STRUCTURE: Navy blue wave 4
POSITION: Gray wave 1
DIRECTION NEXT HIGHER DEGREES: Navy blue wave 5
DETAILS: Navy blue wave 3 appears complete; navy blue wave 4 is currently forming.
Cancel invalid level: 1.05331
The EURUSD Elliott Wave daily analysis identifies an unfolding corrective counter-trend pattern, labeled as navy blue wave 4, developing within gray wave 1, which follows the completion of navy blue wave 3’s bullish impulse.
This corrective wave structure indicates a temporary pause in the prevailing uptrend, with expectations for upward continuation once wave 4 concludes. The key invalidation level at 1.05331 serves as a critical benchmark for confirming or negating the wave scenario.
From a daily Elliott Wave perspective, this setup offers a clear snapshot of the current correction while aligning with the broader bullish count. Wave 5 of navy blue degree is expected to resume the larger trend to the upside after wave 4 completes.
The structure maintains clear wave hierarchy: navy blue wave 4 is part of gray wave 1. Traders should monitor typical corrective formations—such as an ABC pattern or sideways consolidation—commonly found in wave 4 corrections.
This technical phase presents potential for short-term counter-trend trades during the correction and strategic entries aligned with the next impulse wave in the dominant uptrend. The daily chart continues to be a vital tool in tracking EURUSD price action using Elliott Wave principles.
EURUSD Elliott Wave Analysis | Trading Lounge Daily Chart
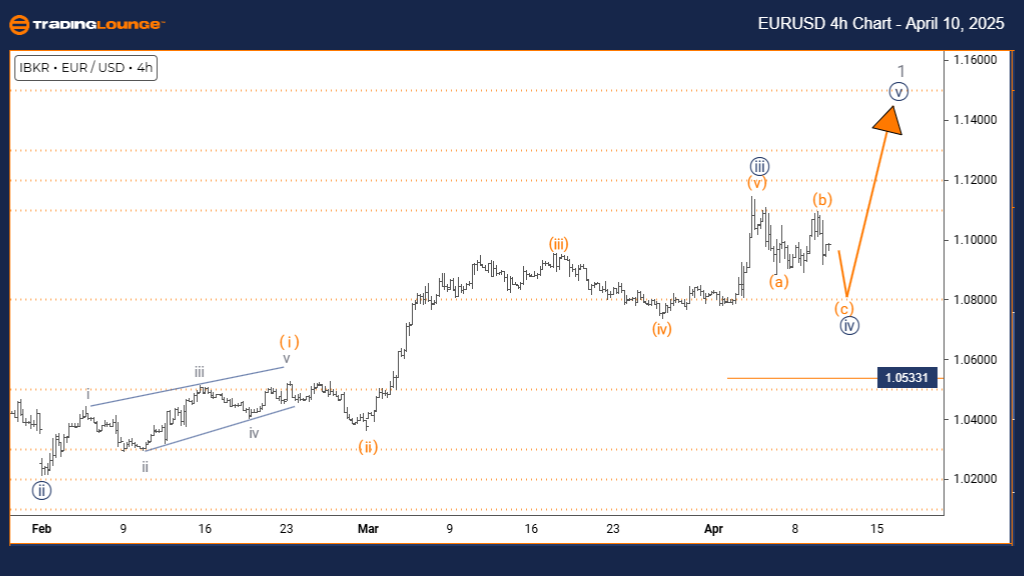
Euro/ U.S. Dollar (EURUSD) 4-Hour Chart
EURUSD Elliott Wave Technical Forecast
FUNCTION: Counter-Trend
MOD: Corrective
STRUCTURE: Navy blue wave 4
POSITION: Gray wave 1
DIRECTION NEXT HIGHER DEGREES: Navy blue wave 5
DETAILS: Navy blue wave 3 appears complete; navy blue wave 4 is currently developing.
Cancel invalid level: 1.05331
The EURUSD 4-hour Elliott Wave analysis outlines an active corrective phase, identified as navy blue wave 4 within the ongoing gray wave 1. With wave 3 likely completed, the market is now retracing in wave 4, setting the stage for the next impulsive advance.
A key invalidation point at 1.05331 is highlighted, which traders should monitor closely. A move below this level would invalidate the current wave count and suggest a reassessment of the structure is needed.
This intraday timeframe offers a sharper view of the correction's evolution while maintaining the integrity of the broader wave count. Once wave 4 completes, wave 5 is expected to initiate, continuing the primary uptrend.
Understanding the wave relationship—where navy blue wave 4 is a component of gray wave 1—is essential. Traders should look for common wave 4 behaviors such as zigzags, flats, or triangles, signaling the final stages of the correction.
This scenario provides opportunities for intraday counter-trend trades, as well as setups for longer-term trend continuation positions as the market prepares for wave 5. The 4-hour chart remains instrumental in applying Elliott Wave trading strategies to the EURUSD.
Technical Analyst: Malik Awais
Source: Visit Tradinglounge.com and learn from the Experts Join TradingLounge Here
Previous: GBPJPY Elliott Wave Technical Analysis
VALUE Offer - Buy 1 Month & Get 3 Months!Click here
Access 7 Analysts Over 200 Markets Covered. Chat Room With Support