INFOSYS – INFY Elliott Wave Analysis TradingLounge (1D Chart)
INFY Elliott Wave Technical Analysis
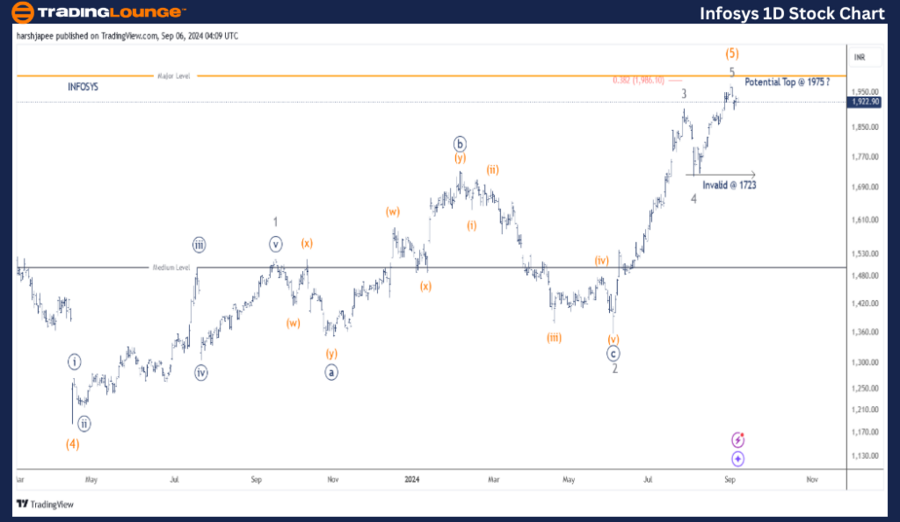
Function: Larger Degree Trend Higher (Intermediate degree, orange)
Mode: Motive
Structure: Impulse
Position: Minor Wave 5 Grey
Details: Minor Wave 5 Grey is advancing within Intermediate Wave (5) Orange, targeting a resistance level at 1723. Alternatively, Minor Wave 5 Grey may have completed at 1975.
Invalidation point: 1723
INFOSYS Daily Chart Technical Analysis and Potential Elliott Wave Counts
The INFOSYS daily chart indicates a potential major top near the 1975 level, or it could approach a top within the 1986-2000 range, as projected by the Fibonacci 0.382 extension. In either case, a higher degree correction might begin soon.
The stock concluded its Intermediate Wave (4) around the 1180 level in April 2023. Since then, it has surged to 1975, achieved on September 2, 2024. The entire rally appears to follow a five-wave structure, labeled as Minor Waves 1 through 5.
Minor Wave 4 completed around the 1723 mark, and a break below this level would confirm a bearish outlook. Alternatively, the stock may continue its rally to the 1986-2000 range before completing Minor Wave 5 of Intermediate Wave (5).
INFOSYS – INFY Elliott Wave Analysis TradingLounge (4H Chart)
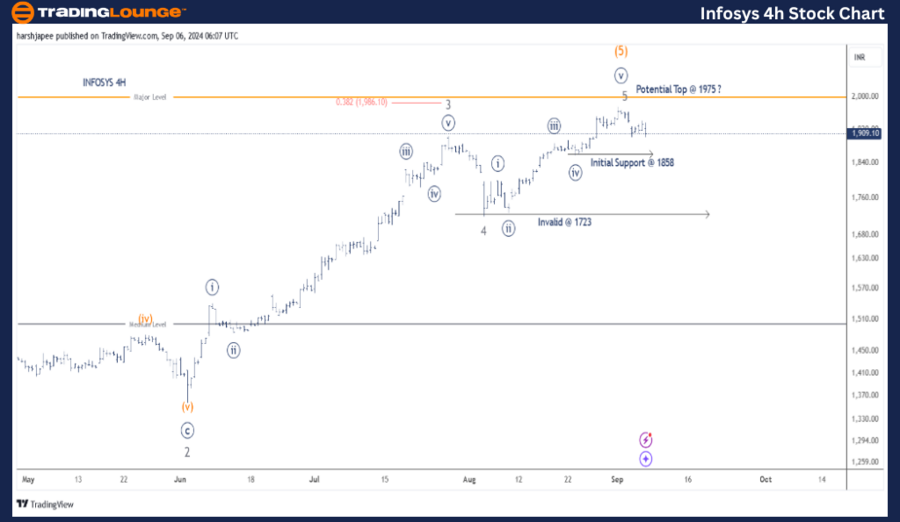
Function: Larger Degree Trend Higher (Intermediate degree, orange)
Mode: Motive
Structure: Impulse
Position: Minor Wave 5 Grey
Details: Minor Wave 5 Grey is progressing within Intermediate Wave (5) Orange, moving against the 1723 support level. Alternatively, Minor Wave 5 Grey may have completed at 1975. With broader market indices like Nifty 50 and many technology stocks nearing their peaks, it might be a good opportunity to take profits.
Invalidation point: 1723
TCS 4H Chart Technical Analysis and Potential Elliott Wave Counts
The INFOSYS 4H chart emphasizes the sub-waves within Minor Waves 3 and 4. Each wave could represent a potential impulse, with Minute Wave ((v)) Navy potentially finishing around the 1975 level. Alternatively, Minor Wave 5 could extend after a correction.
Immediate support lies at the 1858 level, and a break below it would add more confidence to the bearish scenario. While the downward trend is still in its early stages, traders are advised to consider taking profits now.
Technical Analyst: Harsh Japee
Source: visit Tradinglounge.com and learn From the Experts Join TradingLounge Here
Previous: Tata Consultancy Services Elliott Wave Technical Analysis
Special Trial Offer - 0.76 Cents a Day for 3 Months! Click here
Access 7 Analysts Over 200 Markets Covered. Chat Room With Support
Conclusion:
INFOSYS may have reached a top at 1975, or it is nearing a top in the 1986-2000 range. In either case, a correction is expected soon.