TATA CONSULTANCY SERVICES – TCS Elliott Wave Analysis (1D Chart)
TCS Elliott Wave Technical Analysis
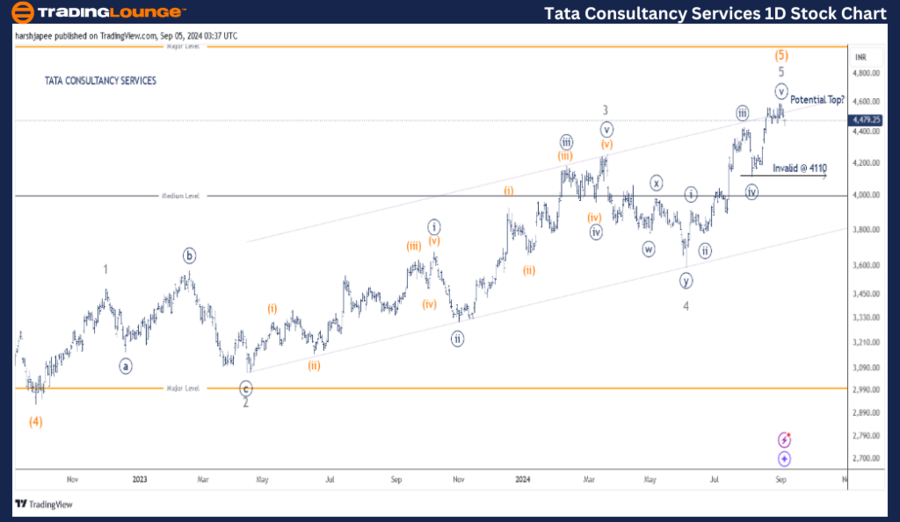
Function: Larger Trend Higher (Intermediate Degree Wave (5), Orange)
Mode: Motive
Structure: Impulse
Position: Minute Wave ((v)) Navy
Details: Minute Wave ((v)) Navy is approaching completion around the 4600 level, or it may already be complete. Traders should consider taking profits now and exercise caution. Channel resistance has been tested, indicating that a major potential top could be forming.
Invalidation Point: 4110TCS
Daily Chart Technical Analysis and Potential Elliott Wave Counts
The daily chart of TCS suggests a potential top forming near the 4600 mark. At the time of writing, the stock has pulled back slightly and is trading around 4460. While it may still be early, there is a possibility that Minute Wave ((v)) Navy within Minor Wave 5 Grey has completed.
TCS has been rallying within Intermediate Wave (5) Orange since hitting lows around 2920 in September 2022. This move can be subdivided into five waves, potentially terminating near the 4600 mark on September 2, 2024.
It's also important to note the channel resistance being tested near the 4600 zone. If the structure holds, the stock may face downward pressure, with an initial support target around 4110. Alternatively, a decisive move above 4600 would invalidate the bearish outlook.
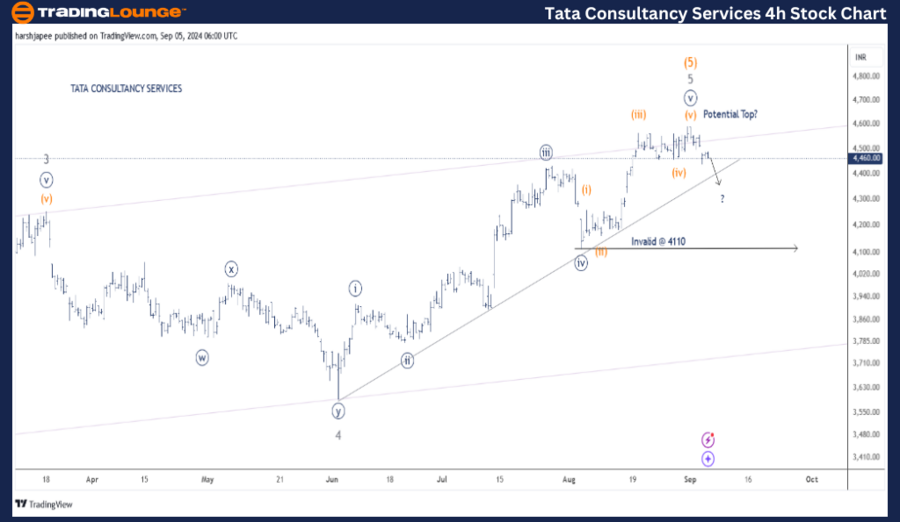
TATA CONSULTANCY SERVICES – TCS Elliott Wave Analysis (4H Chart)
Function: Larger Trend Higher (Intermediate Degree Wave (5), Orange)
Mode: Motive
Structure: Impulse
Position: Minute Wave ((v)) Navy
Details: Minute Wave ((v)) Navy is nearing completion around the 4600 mark. The rally from 4110 to 4600 can be subdivided into five waves. Traders should consider taking profits now and remain cautious, as channel resistance has been tested. A major potential top could be in place.
Invalidation Point: 4110
TCS 4H Chart Technical Analysis and Potential Elliott Wave Counts
The 4-hour chart for TCS identifies the rally between Minor Wave 4 at 4110 and the 4600 level as an impulse wave. The Minuette wave appears complete around 4600, with prices reversing sharply. If this holds, the stock could decline below 4110 shortly.
Technical Analyst: Harsh Japee
Source: visit Tradinglounge.com and learn From the Experts Join TradingLounge Here
Previous: SBI LIFE INSURANCE CO Elliott Wave Technical Analysis
Special Trial Offer - 0.76 Cents a Day for 3 Months! Click here
Access 7 Analysts Over 200 Markets Covered. Chat Room With Support
Conclusion:
TCS may be setting up for a larger corrective wave following the 4600 high. While it could still be early, traders should remain cautious at these levels and consider securing profits.