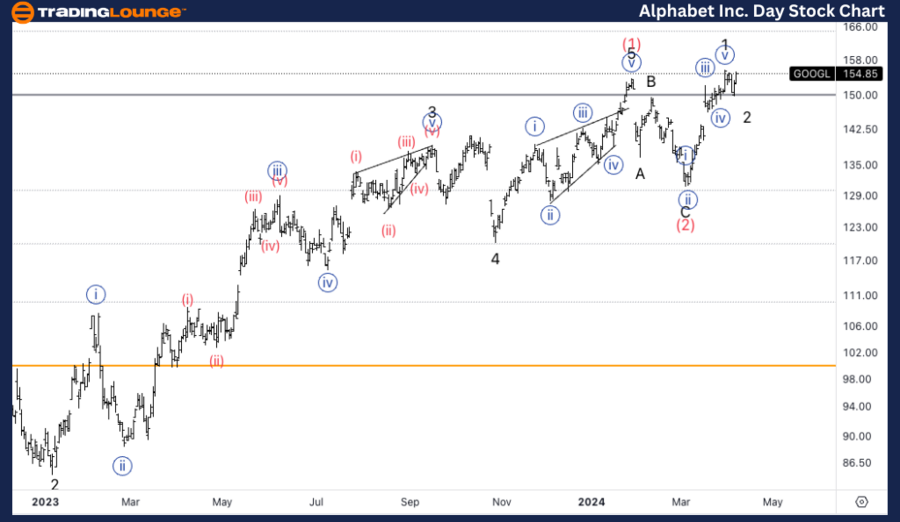
Alphabet Inc. (GOOGL) Elliott Wave Analysis on the Daily Chart
When diving into the technical analysis of Alphabet Inc. (GOOGL) through the lens of the Elliott Wave theory on a daily chart basis, we observe a significant bullish trend in motion. This analysis is crucial for traders and investors aiming to grasp the future movements of GOOGL stocks, leveraging the insights to align with the prevailing market trends effectively.
Alphabet Inc., (GOOGL) Daily Chart Analysis
GOOGL Elliott Wave Technical Analysis
GOOGL Technical Analysis Overview:
- Function: The primary function identified is the trend, highlighting the stock's general direction.
- Mode: An impulse mode is observed, indicating a strong and clear movement in the stock's price.
- Structure: The structure is motive, suggesting that the stock is in a phase of directional market moves that align with the overall trend.
- Position: The current position is at an intermediate level (3), a critical stage indicating significant momentum.
- Direction: The analysis points towards an upside in wave 3 of (3), suggesting a bullish scenario for Alphabet. This stage, known as a third of a third, often signifies a strong and sustained upward movement.
- Alternatives: There's also the potential for a transition into wave (4), succeeding a wave (2) position, and eventually moving into an upside within wave (5).
The detailed Elliott Wave analysis for GOOGL on the daily chart underscores a bullish outlook, projecting a strong and sustained upward trajectory. This presents an optimistic scenario for investors, indicating potentially profitable opportunities ahead.
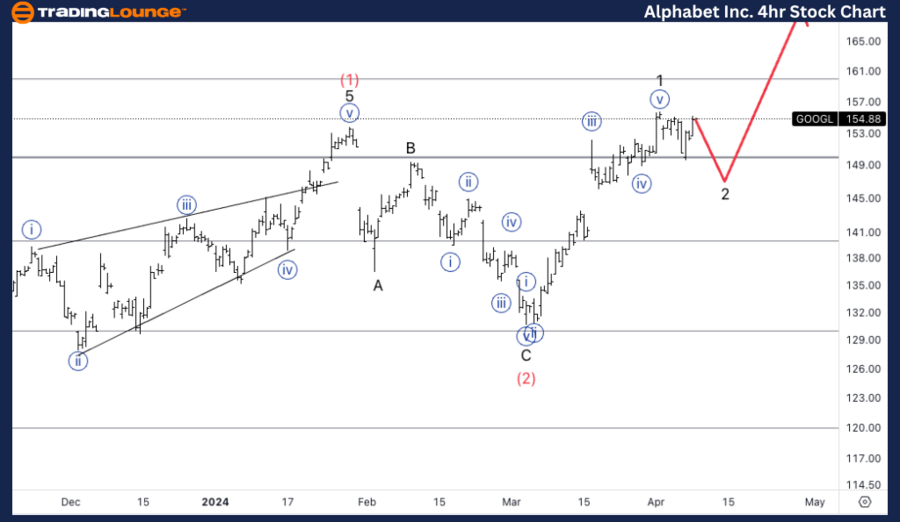
Alphabet Inc. (GOOGL) Elliott Wave Analysis on the 4-Hour Chart
Alphabet Inc., (GOOGL) 4H Chart Analysis
GOOGL Elliott Wave Technical Analysis
Shifting the focus to a more granular view with the 4-hour (4H) chart analysis of Alphabet Inc. (GOOGL), the Elliott Wave theory continues to provide valuable insights into the stock's potential short-term movements.
GOOGL Technical Analysis Overview:
- Function: The trend remains the primary function, underlining the direction in which the stock is expected to move.
- Mode: Similar to the daily chart, the impulse mode is identified, showcasing clear directional momentum.
- Structure: The structure is again motive, pointing towards a directional movement that echoes the broader market trend.
- Position: The stock finds itself in wave {b} of 2, a pivotal position indicating the potential for movement.
- Direction: A downside in wave {c} of 2 is anticipated, suggesting a bearish turn in the short term. This could potentially lead to another leg lower into wave {c} of 2.
- Support and Potential Upside: Interestingly, there seems to be significant support around the $150 medium level. This support could catalyze a shift, leading to further upside from the current position.
The 4-hour chart analysis provides a nuanced view of GOOGL’s potential movements, indicating a short-term bearish phase that could precede an upward trajectory. The identification of strong support at the $150 level offers a glimmer of hope for an impending bullish reversal, making it a critical juncture for traders to watch.
Conclusion:
The Elliott Wave analysis of Alphabet Inc. (GOOGL) across both daily and 4-hour charts presents a comprehensive picture of the stock's potential movements. While the daily chart projects a strong bullish trend, the 4-hour chart suggests a temporary bearish phase with potential for reversal. This dual perspective offers investors and traders a balanced view, enabling strategic decision-making based on short-term challenges and long-term opportunities.
Technical Analyst: Alessio Barretta
Source: visit Tradinglounge.com and learn From the Experts Join TradingLounge Here
See Previous: NVIDIA Corp.(NVDA)
TradingLounge Once Off SPECIAL DEAL: Here > 1 month Get 3 months.
TradingLounge's Free Week Extravaganza!
April 14 – 21: Unlock the Doors to Trading Excellence — Absolutely FREE