Silver (XAGUSD) Commodity Elliott Wave Analysis


Silver Elliott Wave Technical Analysis

Function: Trend

Mode: Trend

Structure: Impulse for blue wave A

Position: Wave 5 of (5)

Direction: Wave 5 of (5) in play

Details: 

Wave 5 of (5) extends higher. There appears to be room for more before prices start turning down for a retracement. Same interpretation as the previous update.

Silver has moved sideways for nearly 72 hours amid a strong year-long bullish trend. The price is more likely to break to the upside to continue this trend. However, if it breaks to the downside, buyers are expected to push the price up again shortly thereafter. Nevertheless, a significant pullback lasting several weeks is anticipated at some point. The question is: how much higher can the metal go before this pullback?

Detailed Wave Analysis

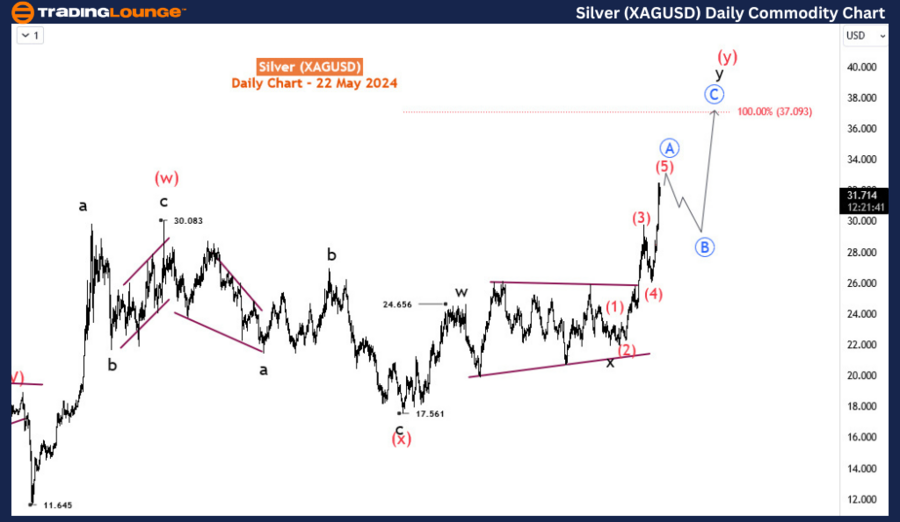
On the daily chart, the price extends the bullish sequence that began at 11.645 in March 2020. This sequence could either complete a double zigzag with a 100% target at 37 and potentially extend further to 48.3. If 48.3 is breached, the likelihood that the sequence will turn into an impulse wave increases. Whether it becomes an impulse or remains a corrective sequence is not crucial at this point since both scenarios project further rallies, with the impulse wave having a higher target. Currently, attention should be on the impulse sequence that started in January 2024, which is expected to complete blue wave A of the primary degree or blue wave 1 of an impulse. The impulse is close to completing its 5th wave—wave 5—after which a pullback is expected.

Silver-XAGUSD-Daily-...


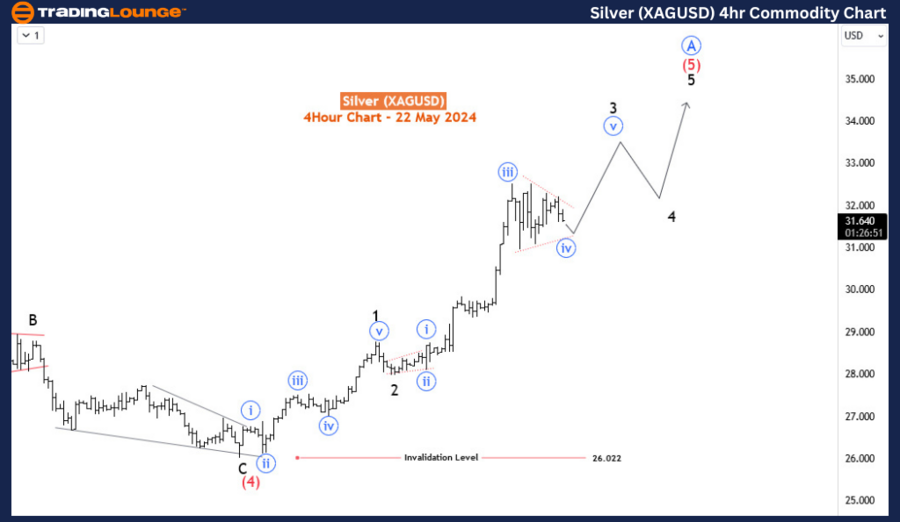
Silver 4-hour Chart Analysis

The H4 chart shows the progress of wave (5) of the impulse and how much further it could go before the pullback begins. The price is currently in wave 3 of (5). Wave 3 appears to be incomplete, with the current triangle serving as the 4th sub-wave of wave 3, i.e., blue wave iv. Traders can expect the triangle to break to the upside to complete wave 3, followed by a minor pullback for wave 4 and further advances for wave 5. At the end of wave 5, we can expect a peak and a downward turn for primary degree wave B (in blue on the daily chart), which could last for several weeks.

Technical Analyst: Sanmi Adeagbo

Source: visit Tradinglounge.com and learn From the Experts Join TradingLounge Here 

See Previous: Copper Commodity Elliott Wave Analysis

Special Trial Offer - 0.76 Cents a Day for 3 Months! Click here

Access 7 Analysts Over 170 Markets Covered. Chat Room With Support

Silver-XAGUSD-4Hr-Co...

Related

NextEra Energy Inc.(NEE) Stocks Elliott Wave Technical Analysis: Covers Stock Predictions, Technical insights, And wave pattern analysis

NextEra Energy Inc.(NEE) Stocks Elliott Wave Technical Analysis: Covers Stock Predictions, Technical insights, And wave pattern analysis

This article provides an in-depth Elliott Wave analysis of NextEra Energy Inc. (NEE) on both daily a...

Read More >
Comprehensive AUD/USD Elliott Wave Analysis: Daily & 4-Hour Charts Reveal Key Trends and Technical Levels for Forex Traders

Comprehensive AUD/USD Elliott Wave Analysis: Daily & 4-Hour Charts Reveal Key Trends and Technical Levels for Forex Traders

This analysis provides an in-depth look at the AUD/USD currency pair through the lens of Elliott Wav...

Read More >
Theta Token/U.S. dollar(THETAUSD) Elliott Wave Technical Analysis 10 November 23

Theta Token/U.S. dollar(THETAUSD) Elliott Wave Technical Analysis 10 November 23

Theta Token/U.S. dollar(THETAUSD) Elliott Wave Technical Analysis 10 November 23 indicating an uptre...

Read More >
Insights into BTCUSD price prediction and trading strategies: Bitcoin Crypto Price News Today Elliott Wave Technical Analysis

Insights into BTCUSD price prediction and trading strategies: Bitcoin Crypto Price News Today Elliott Wave Technical Analysis

This article provides an in-depth BTCUSD Elliott Wave analysis, offering insights into Bitcoin price...

Read More >
Get Specific Price Targets: Westpac Banking Corporation Stock Analysis & Elliott Wave Technical Forecast

Get Specific Price Targets: Westpac Banking Corporation Stock Analysis & Elliott Wave Technical Forecast

Our comprehensive Elliott Wave analysis for WESTPAC BANKING CORPORATION (WBC) on the Australian Stoc...

Read More >
Johnson & Johnson (JNJ:NYSE) Elliott Wave Technical Analysis 6 December 23

Johnson & Johnson (JNJ:NYSE) Elliott Wave Technical Analysis 6 December 23

Johnson & Johnson (JNJ:NYSE) Elliott Wave Technical Analysis dated 6 December 23,

Read More >

$1 for 2 Weeks

then $29 a month!

What a Special Offer!

Trade Recommendations

Unleash the power of deversified trading with our comprehensive portfolio, covering 250+ markets:

  • Stock Trades
  • Crypto Trades
  • Forex Trades
  • Commodity Trades
Elliott Wave Analysis

Gain a competitive edge with expert insights and AI-powered Elliott Wave charting into:

  • Global Indices
  • US Stocks & ASX Stocks
  • Forex & Crypto
  • Commodities
Top-Notch Trading Tools

Equip yourself with the tools of success:

  • Real-time Chat rooms
  • Elliott Wave Algorithm
  • Portfolio tools
  • TradingLevels
  • Screener
  • Trading Game
7 Elliott Wave Analysts

Stay ahead of the market with daily charts and insightful videos
Your secret to strategic trading!

JOIN HERE


Welcome to TradingLounge (ASIC A.R.No. 321187), specialists in trades, trading education and technical analysis, covering stocks, indices, commodities, forex and cryptocurrencies.

When you join TradingLounge you have access to everything we offer, including trade tools, educational content and a social platform to chat with like-minded investors.

Read more

@Copyright 2024 by tradinglounge.com

Contact Us

Australian no: 02 4787 6020

International no: +61 (2) 47876020

Pay with:

Find us on