Copper Commodity Elliott Wave Analysis

Copper Elliott Wave Technical Analysis

Function: Trend

Mode: Impulse

Structure: Impulse Wave
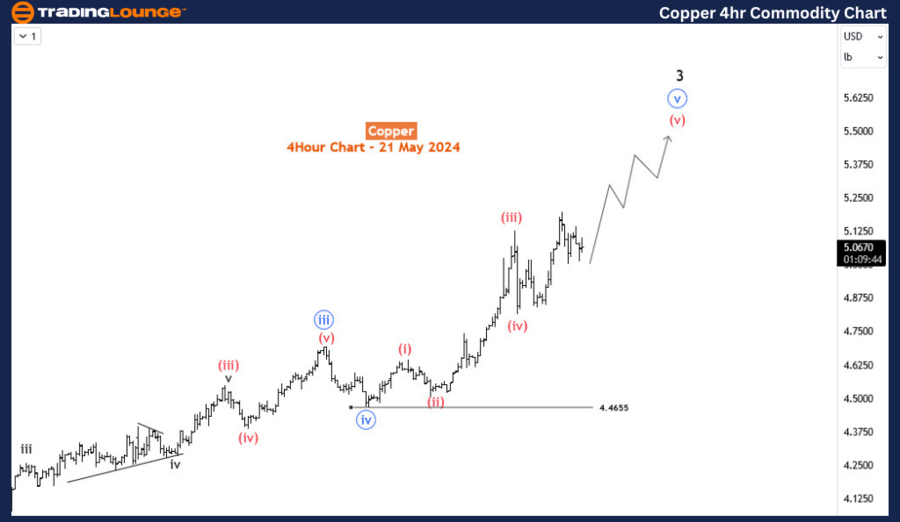
Position: Wave 3

Direction: Wave 3 is still in progress

Details: Price rallied above the $5.00 major level as wave 3 seeks completion. There is still room for more upside before the price turns down for wave 4 pullback.

Copper Performance in 2024

Copper has been one of the strongest commodities in 2024, rising over 32% year-to-date and poised for more gains before the first half of the year concludes. The bullish cycle started in July 2022 but experienced a rough patch in 2023 before resuming its upward trend in 2024.

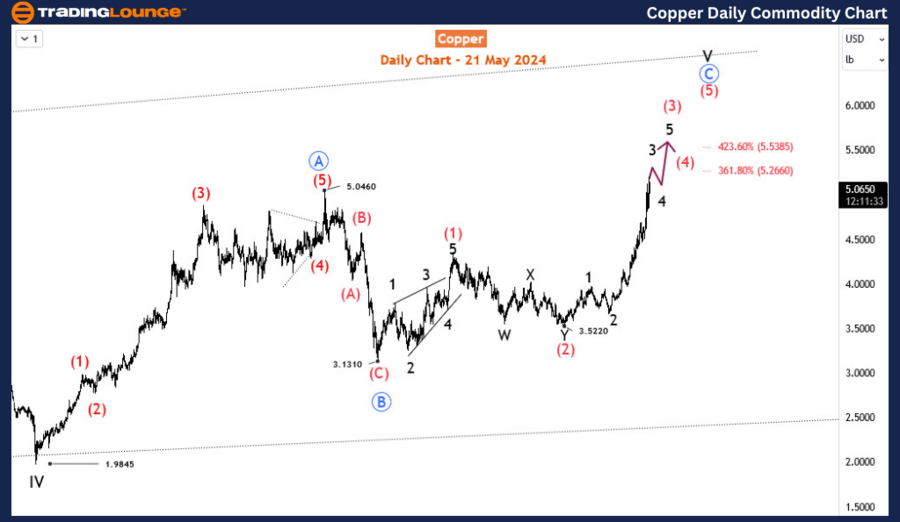
Historical Elliott Wave Structure

Copper's long-term Elliott wave structure can be traced back to pre-2000 when a diagonal structure began to emerge. In March 2020, the cycle degree fourth wave of the diagonal, wave IV, concluded below $2. Since then, prices have moved upwards in a 3-swing structure to complete wave V, subdivided into blue waves A, B, and C. Blue wave A ended above $5.04 in March 2022 with an impulse wave structure. Subsequently, blue wave B formed and concluded in August 2022 at $3.23 with a zigzag structure.

Since August 2022, blue wave C has emerged and is expected to complete an impulse, subdivided into waves (1), (2), (3), (4), and (5). Waves (1) and (2) have already concluded, and the price is now in wave (3), which started at $3.52 in October 2023. Currently, the price is in wave 3 of (3). This analysis indicates that blue wave C still has some way to go before completion.

Copper-Daily-commodi...


Current Analysis on H4 Chart

On the H4 chart, we can observe the progress of wave 3 of (3). The price is currently in wave (v) of blue wave iii of 3, indicating that wave 3 is nearing completion. An extension to the Fibonacci zone of 5.266-5.538 is likely, and wave 4 could potentially start from there. The copper price action favors buyers who are looking to buy after dips.

Conclusion

Copper's Elliott wave analysis shows a clear upward trend with the price currently in wave 3 of (3). With the potential for further gains before wave 4 starts, traders should be prepared for both the continuation of the upward trend and the subsequent corrective pullback. Monitoring the Fibonacci extension zone and wave structure will be crucial for making informed trading decisions.

Technical Analyst: Sanmi Adeagbo

Source: visit Tradinglounge.com and learn From the Experts Join TradingLounge Here 

See Previous: Natural Gas Commodity Elliottwave Technical Analysis

Special Trial Offer - 0.76 Cents a Day for 3 Months! Click here

Access 7 Analysts Over 170 Markets Covered. Chat Room With Support

Copper-4hr-commodity...

Related

Gain expert insights into Binance Crypto Price BNBUSD Elliott Wave Technical Analysis

Gain expert insights into Binance Crypto Price BNBUSD Elliott Wave Technical Analysis

Gain expert insights into Binance Coin (BNBUSD) with our detailed Elliott Wave Analysis. Understand ...

Read More >
Bitcoin/U.S. dollar(BTCUSD) Elliott Wave Technical Analysis 23 October 23

Bitcoin/U.S. dollar(BTCUSD) Elliott Wave Technical Analysis 23 October 23

Bitcoin/U.S. dollar(BTCUSD) Elliott Wave Technical Analysis on 23 October 23 with BTCUSD Analysis Da...

Read More >
Unlocking ASX Trading Success: ANZ GROUP HOLDINGS LIMITED - ANZ Elliott Wave Analysis & Elliott Wave Technical Forecast

Unlocking ASX Trading Success: ANZ GROUP HOLDINGS LIMITED - ANZ Elliott Wave Analysis & Elliott Wave Technical Forecast

This in-depth Elliott Wave analysis focuses on ASX: ANZ GROUP HOLDINGS LIMITED, highlighting key tec...

Read More >
 ASX Trading Potential: BHP GROUP LIMITED - Elliott Wave Technical Analysis & Technical Forecast

ASX Trading Potential: BHP GROUP LIMITED - Elliott Wave Technical Analysis & Technical Forecast

Our detailed ASX: BHP GROUP LIMITED analysis explores Elliott Wave patterns and technical insights t...

Read More >
NextEra Energy Inc. (NEE) Stocks Elliott Wave Technical Analysis: Offering Insights from Daily and 4-hour charts

NextEra Energy Inc. (NEE) Stocks Elliott Wave Technical Analysis: Offering Insights from Daily and 4-hour charts

This article provides a comprehensive Elliott Wave analysis of NextEra Energy, Inc. (NEE). It covers...

Read More >
Amazon Inc.(AMZN:NASDAQ) Elliott Wave Technical Analysis 5 December 23

Amazon Inc.(AMZN:NASDAQ) Elliott Wave Technical Analysis 5 December 23

Amazon Inc.(AMZN: NASDAQ) Elliott Wave Technical Analysis For 5 December 23 with 1-Hour and 4-Hour S...

Read More >

Buy 1 Month

Get 3 Months!

Special Offer:

Trade Recommendations

Unleash the power of deversified trading with our comprehensive portfolio, covering:

  • Stock Trades
  • Crypto Trades
  • Forex Trades
  • Commodity Trades
Elliott Wave Analysis

Gain a competive edge with expert insights in to:

  • Global Indices
  • US Stocks & ASX Stocks
  • Forex & Crypto
  • Commodities
Top-Notch Trading Tools

Equip yourself with the tools of success:

  • Social Chat
  • Elliott Wave Algorithm
  • Screener
  • TradingLevels
  • Trading Game
7 Elliott Wave Analysts

Stay ahead of the market with daily charts and insightful videos
-Your secret to strategic trading!

JOIN HERE


Welcome to TradingLounge (ASIC A.R.No. 321187), specialists in trades, trading education and technical analysis, covering stocks, indices, commodities, forex and cryptocurrencies.

When you join TradingLounge you have access to everything we offer, including trade tools, educational content and a social platform to chat with like-minded investors.

Read more

@Copyright 2024 by tradinglounge.com

Contact Us

Australian no: 02 4787 6020

International no: +61 (2) 47876020

Pay with:

Find us on