Silver XAGUSD Elliott Wave Technical Analysis

Function: Counter-Trend

Mode: Corrective

Structure: Double Zigzag for wave B (circled)

Position: Wave (Y) of B

Direction: Wave 1 of (1) of C (circled)

Details: Wave B (circled) appears completed, and wave C (circled) is now emerging upwards. Currently, we are counting wave 1 of (1) or wave (1).

Silver Elliott Wave Technical Analysis

Silver Recovery and Forecast Silver is recovering from a pullback that began in late May 2024. This recovery is expected to lead to a series of rallies, continuing the year-long bullish impulse cycle. Long-term and medium-term Elliott Wave forecasts support further rallies for this precious metal.

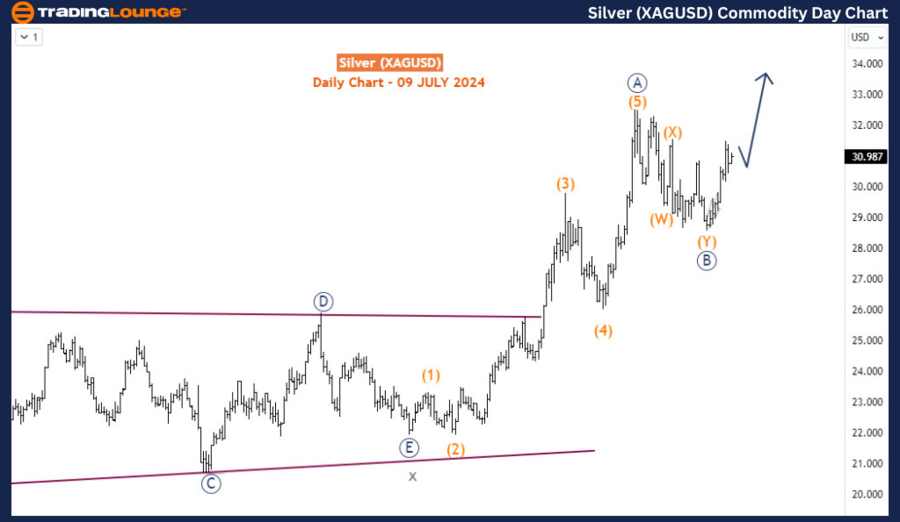
Daily Chart Analysis

On the daily chart, we identified that the impulse wave sequence starting in January 2024 completed in May 2024, followed by a corrective pullback. This bearish corrective structure, which lasted for five weeks, appears to have concluded with a double zigzag pattern. However, the correction is relatively shallow, suggesting the possibility of another leg lower. Yet, if the impulse reaction from late June continues to rise and does not turn corrective, it would indicate that the market has accepted the shallow nature of the pullback. Overall, it is likely that Silver will continue to climb, potentially reaching new highs in 2024.
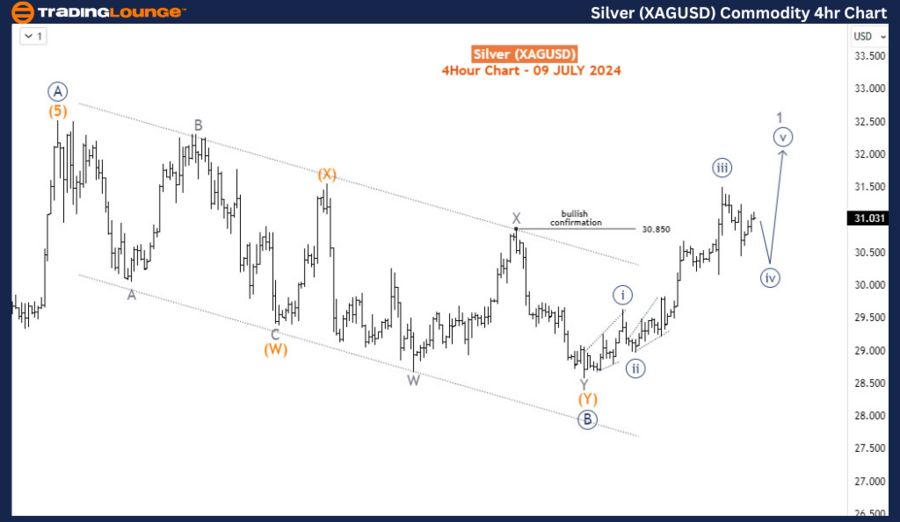
Silver-XAGUSD-Commod...


H4 Chart Analysis

On the H4 chart, the impulse response is in the process of completing the first sub-wave, or wave 1. Currently, wave iv (circled) might experience one more leg lower before reversing upwards to complete wave v (circled), thereby finishing wave 1. Following this, a larger pullback for wave 2 is expected. Conversely, if the current dip extends below $30, we may consider the high on July 5, 2024, as the end of wave 1 and the current dip as wave 2. In either scenario, provided that Silver's price does not approach $28.5, the price action supports further rallies from the dip, continuing the year-long bullish sequence.

Conclusion Both the daily and H4 charts indicate a continued bullish trend for Silver, offering multiple opportunities for traders. By monitoring the development of wave 1 on the H4 chart and the impulse sequence on the daily chart, traders can identify strategic entry points to maximize returns. The recent shallow correction suggests that Silver's bullish momentum remains intact, with further rallies likely as the metal continues its long-term ascent.

Technical Analyst: Sanmi Adeagbo

Source: visit Tradinglounge.com and learn From the Experts Join TradingLounge Here 

See Previous: Cron Elliott Wave Technical Analysis

Special Trial Offer - 0.76 Cents a Day for 3 Months! Click here

Access 7 Analysts Over 170 Markets Covered. Chat Room With Support

Silver-XAGUSD-Commod...

Related

Stay updated on RUSSELL 2000 Index Elliott Wave Technical Analysis with RUT news and economic indicators

Stay updated on RUSSELL 2000 Index Elliott Wave Technical Analysis with RUT news and economic indicators

This article provides an in-depth analysis of the Russell 2000 index using Elliott Wave Theory. Lear...

Read More >
Bitcoin / U.S. dollar(BTCUSD) Elliott Wave Technical Analysis 13 November 23

Bitcoin / U.S. dollar(BTCUSD) Elliott Wave Technical Analysis 13 November 23

Bitcoin/U.S. dollar(BTCUSD) Elliott Wave Technical Analysis on 13 November 23 with BTCUSD Analysis D...

Read More >
Learn how to invest in Euro Stoxx 50 stocks: Euro Stoxx 50 Index Elliott Wave Technical Analysis

Learn how to invest in Euro Stoxx 50 stocks: Euro Stoxx 50 Index Elliott Wave Technical Analysis

Stay ahead in Euro Stoxx 50 trading with our comprehensive analysis. This report provides detailed E...

Read More >
Natural Gas Commodity Elliott Technical Analysis: Strategic Trading Opportunities to help you Navigate the Market Effectively

Natural Gas Commodity Elliott Technical Analysis: Strategic Trading Opportunities to help you Navigate the Market Effectively

Explore our detailed natural gas technical analysis through Elliott Wave theory. Learn about the cur...

Read More >
U.S.Dollar/Swiss Franc (USD/CHF)  Forex Elliott Wave Technical  and Currency Pair Analysis

U.S.Dollar/Swiss Franc (USD/CHF)  Forex Elliott Wave Technical and Currency Pair Analysis

This analysis delves into the USD/CHF market dynamics using Elliott Wave theory, providing insights ...

Read More >

Buy 1 Month

Get 3 Months!

Special Offer:

Trade Recommendations

Unleash the power of deversified trading with our comprehensive portfolio, covering:

  • Stock Trades
  • Crypto Trades
  • Forex Trades
  • Commodity Trades
Elliott Wave Analysis

Gain a competive edge with expert insights in to:

  • Global Indices
  • US Stocks & ASX Stocks
  • Forex & Crypto
  • Commodities
Top-Notch Trading Tools

Equip yourself with the tools of success:

  • Social Chat
  • Elliott Wave Algorithm
  • Screener
  • TradingLevels
  • Trading Game
7 Elliott Wave Analysts

Stay ahead of the market with daily charts and insightful videos
-Your secret to strategic trading!

JOIN HERE


Welcome to TradingLounge (ASIC A.R.No. 321187), specialists in trades, trading education and technical analysis, covering stocks, indices, commodities, forex and cryptocurrencies.

When you join TradingLounge you have access to everything we offer, including trade tools, educational content and a social platform to chat with like-minded investors.

Read more

@Copyright 2024 by tradinglounge.com

Contact Us

Australian no: 02 4787 6020

International no: +61 (2) 47876020

Pay with:

Find us on