Commodity Trading: Corn Elliott Wave Analysis

Function: Trend

Mode: Trend

Structure: Expected Impulse wave for (3)

Position: Wave iii (circled) of 3

Direction: Wave iii (circled) of 3 is still in progress

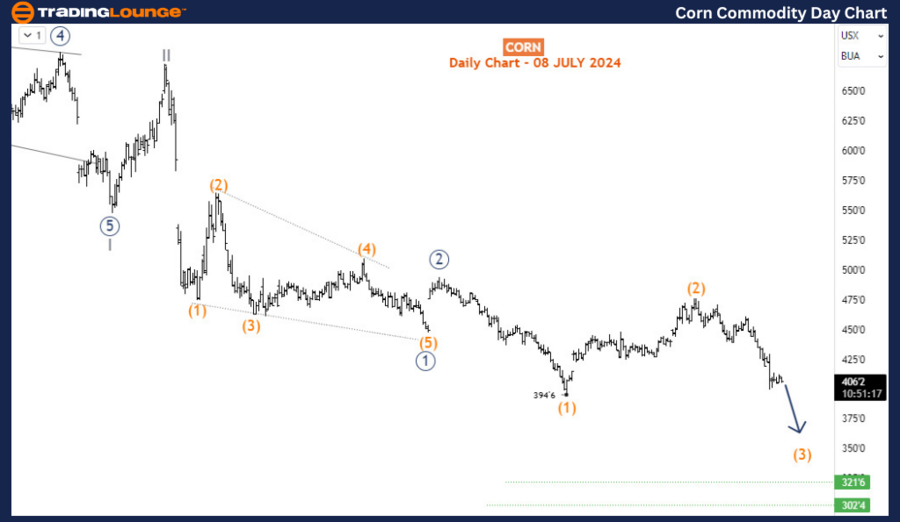
Details: Wave (2) appears to have been completed as indicated by the daily chart. We are now in wave (3), expected to drop below the 400 mark.

Corn Elliott Wave Technical Analysis

Corn prices have extended their sell-off from May 14th and are poised for further declines after breaking out of the sideways structure formed in July. This ongoing downtrend suggests that the commodity will likely trade below $400 before a corrective rebound materializes.

Daily Chart Analysis

On the daily chart, we have been tracking the latter part of a significant bearish impulse that began in April 2022. This impulse wave is currently navigating its third wave - wave (III) of the super cycle degree. The completion of wave II of (III) occurred in January 2023, and the price is now unfolding the sub-waves of wave III of (III). Specifically, the daily chart indicates that the price is favoring the downside in wave (3) of 3 (circled) of III. This chain of third waves within third waves (a fractal characteristic of Elliott Waves) implies that Corn prices will likely sink much lower in the coming months. The next significant breakdown is expected to push the commodity below the previous low of 394'6, potentially reaching levels not seen since 2020. Our primary focus now is to analyze wave (3) in detail and find optimal positions along this bearish trend.
Corn-Commodity-day-C...


H4 Chart Analysis

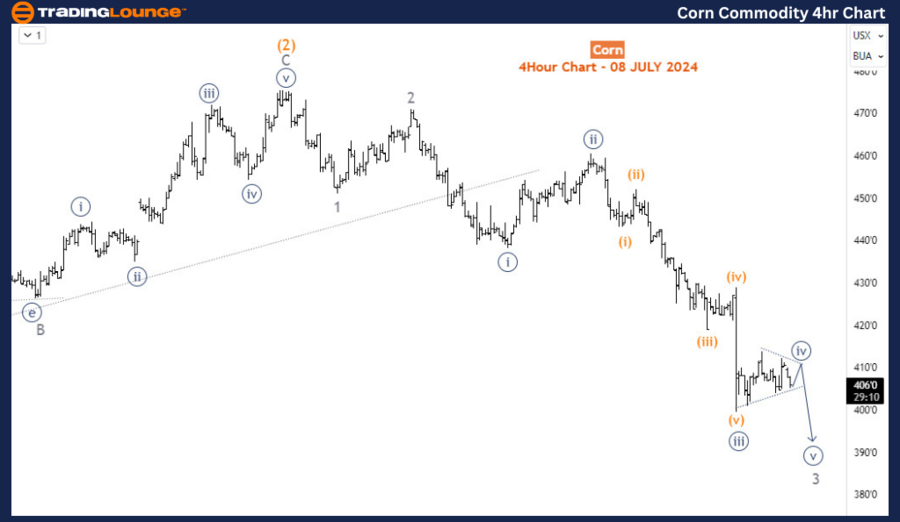
On the H4 chart, the price action is yet to complete wave 3 of (3). The market is currently consolidating in a sideways movement, which is indicative of the 4th sub-wave of 3. This suggests that there may be a selling opportunity once the price breaks down from this consolidation, targeting the 5th sub-wave of 3. However, a more favorable trading opportunity might present itself after the completion of the wave 4 corrective bounce. Traders should anticipate potential SHORT positions at the end of wave 4, aiming to capitalize on the subsequent sell-off in wave 5 of (3) before a larger corrective bounce for wave (4) begins.

In conclusion, both the daily and H4 charts point towards a continued bearish trend for Corn prices, with multiple opportunities for traders to position themselves for further declines. By closely monitoring the unfolding of wave (3) on the daily chart and the sub-waves on the H4 chart, traders can identify strategic entry points to maximize their returns amidst this downward movement.

Technical Analyst: Sanmi Adeagbo

Source: visit Tradinglounge.com and learn From the Experts Join TradingLounge Here 

See Previous: Iron Ore Elliott Wave Technical Analysis

Special Trial Offer - 0.76 Cents a Day for 3 Months! Click here

Access 7 Analysts Over 170 Markets Covered. Chat Room With Support
Corn-Commodity-4hr-C...

Related

Commodity Market Update: Elliott Wave Analysis and Outlook

Commodity Market Update: Elliott Wave Analysis and Outlook

Commodity Market Elliott Wave Analysis Update: The dollar and yields are on the rise, while gold, si...

Read More >
XRPUSD Elliott Wave Technical Analysis: XRP Price Prediction, Trading Strategy, and Technical Indicators

XRPUSD Elliott Wave Technical Analysis: XRP Price Prediction, Trading Strategy, and Technical Indicators

This article provides a comprehensive XRPUSD Elliott Wave analysis, highlighting the price predictio...

Read More >
The TJX Companies Inc. (TJX) Stocks Elliott Wave Technical Analysis: Elliott Wave Insights and Predictions

The TJX Companies Inc. (TJX) Stocks Elliott Wave Technical Analysis: Elliott Wave Insights and Predictions

Discover an in-depth TJX stock analysis through Elliott Wave Theory, examining both daily and 4-hour...

Read More >
Improve your Investment Decisions with Expert Tips and Forecasts: IBEX 35 (Spain) Index Elliott Wave Technical Analysis

Improve your Investment Decisions with Expert Tips and Forecasts: IBEX 35 (Spain) Index Elliott Wave Technical Analysis

Our comprehensive guide on IBEX 35 trading and investing offers detailed Elliott Wave analysis and t...

Read More >
Tesla Inc.(TSLA:NASDAQ) Elliott Wave Technical Analysis 9 November 23

Tesla Inc.(TSLA:NASDAQ) Elliott Wave Technical Analysis 9 November 23

Tesla Inc.(TSLA: NASDAQ) Elliott Wave Technical Analysis on 9 November 23, and TSLA Stock Market Ana...

Read More >
U.S. Dollar / Canadian Dollar Elliott Wave Technical Analysis: Navigate the Current Market Structure of USDCAD Effectively

U.S. Dollar / Canadian Dollar Elliott Wave Technical Analysis: Navigate the Current Market Structure of USDCAD Effectively

This article provides an in-depth Elliott Wave analysis of the USDCAD currency pair. With insights o...

Read More >

Buy 1 Month

Get 3 Months!

Special Offer:

Trade Recommendations

Unleash the power of deversified trading with our comprehensive portfolio, covering:

  • Stock Trades
  • Crypto Trades
  • Forex Trades
  • Commodity Trades
Elliott Wave Analysis

Gain a competive edge with expert insights in to:

  • Global Indices
  • US Stocks & ASX Stocks
  • Forex & Crypto
  • Commodities
Top-Notch Trading Tools

Equip yourself with the tools of success:

  • Social Chat
  • Elliott Wave Algorithm
  • Screener
  • TradingLevels
  • Trading Game
7 Elliott Wave Analysts

Stay ahead of the market with daily charts and insightful videos
-Your secret to strategic trading!

JOIN HERE


Welcome to TradingLounge (ASIC A.R.No. 321187), specialists in trades, trading education and technical analysis, covering stocks, indices, commodities, forex and cryptocurrencies.

When you join TradingLounge you have access to everything we offer, including trade tools, educational content and a social platform to chat with like-minded investors.

Read more

@Copyright 2024 by tradinglounge.com

Contact Us

Australian no: 02 4787 6020

International no: +61 (2) 47876020

Pay with:

Find us on