ASX: REA Group Ltd – REA Elliott Wave Technical Analysis (1D Chart)

In our latest Elliott Wave analysis, we explore the price movements of REA Group Ltd, listed on the Australian Stock Exchange under the ticker ASX: REA. Recent developments suggest significant potential for upward movement in the stock price following the completion of wave 2-red.

REA Elliott Wave Technical Analysis

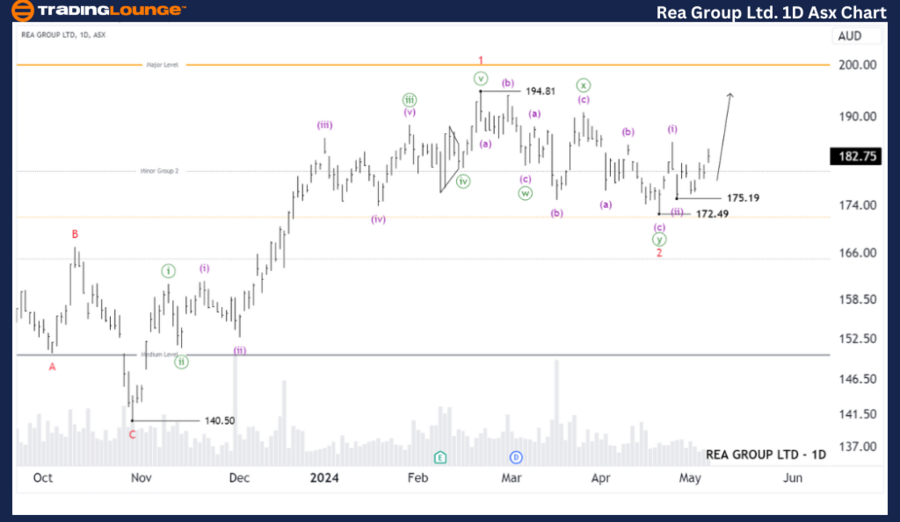
ASX: REA Group Ltd – REA 1D Chart (Semilog Scale) Overview:

  • Function: Tracks the major trend with a focus on minor degrees marked in red.
  • Mode: Motive, indicating directional movements.
  • Structure: Impulse, typical of strong trend movements.
  • Position: Currently in wave (iii)-purple, a component of the broader wave 3-red.

Detailed Analysis: The trading pattern for REA Group Ltd indicates that the recent conclusion of wave 2-red has set the stage for an aggressive upward trend in wave 3-red. This major wave is now subdividing into smaller segments, specifically waves (i) and (ii)-purple, both of which have completed. We are now witnessing the emergence of wave (iii)-purple, which promises to drive prices higher.

Key Point of Invalidation: The bullish outlook remains valid as long as the price does not fall below 175.19.

Rea-Group-Ltd-1D-asx...


ASX: REA Group Ltd – REA Elliott Wave Technical Analysis (4-Hour Chart)

The shorter-term 4-hour chart analysis for REA Group Ltd mirrors the bullish sentiment observed on the daily chart. This detailed examination focuses on the minuette degree movements within the major wave patterns.

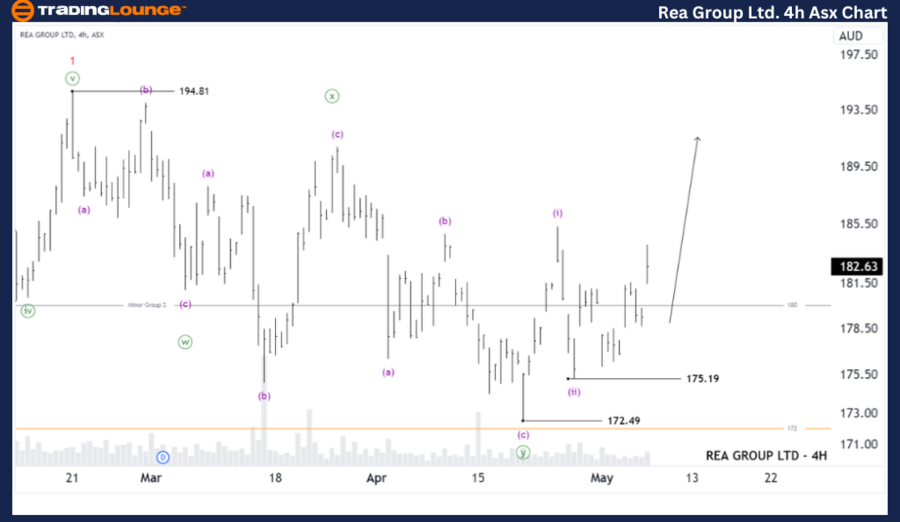
ASX: REA Group Ltd – REA 4-Hour Chart Overview:

  • Function: Emphasizes the major trend with detailed observation at the minuette degree, marked in purple.
  • Mode: Motive, as the pattern suggests a continuation of the current trend.
  • Structure: Impulse, indicative of robust directional trends.
  • Position: Wave (iii)-purple of wave 3-red is currently in progress.

Detailed Analysis: The short-term analysis confirms the ongoing development of wave 3-red, breaking down into initial waves (i) and (ii)-purple, both of which have concluded. The focus now shifts to wave (iii)-purple, expected to propel the stock toward a new target near $200. This advance relies on the critical support level maintaining above 175.19.

Key Point of Invalidation: The bullish scenario will be negated if the price drops below 175.19.

Technical Analyst: Hua (Shane) Cuong, CEWA-M (Master’s Designation)

Source: visit Tradinglounge.com and learn From the Experts Join TradingLounge Here 

Previous: WiseTech Global Limited (WTC) Elliott Wave Technical Analysis

Special Trial Offer - 0.76 Cents a Day for 3 Months! Click here

Access 7 Analysts Over 170 Markets Covered. Chat Room With Support

Rea-Group-Ltd-4hr-as...


Conclusion: Both the daily and 4-hour charts for REA Group Ltd indicate a robust bullish phase aligned with the principles of Elliott Wave analysis. The completion of wave 2-red has paved the way for a vigorous ascent in wave 3-red, subdividing further into dynamic sub-waves. Investors and traders should monitor the support level at 175.19 closely, as staying above this threshold is crucial for the continuation of the upward momentum towards the $200 mark.

Related

Comprehensive Analysis of the Swiss Market Index (SMI) delves into the Elliott Wave Technical Analysis: day and weekly charts

Comprehensive Analysis of the Swiss Market Index (SMI) delves into the Elliott Wave Technical Analysis: day and weekly charts

This comprehensive analysis of the Swiss Market Index (SMI) delves into the Elliott Wave patterns on...

Read More >
Gold (XAUUSD) Commodity Elliott Wave Technical Analysis: Covering Key Trends, Wave Structures, and Corrective Phases

Gold (XAUUSD) Commodity Elliott Wave Technical Analysis: Covering Key Trends, Wave Structures, and Corrective Phases

Explore an in-depth Gold Elliott Wave Analysis covering key trends, wave structures, and corrective ...

Read More >
Euro/U.S.Dollar(EURUSD) Elliott Wave Technical Analysis 19 December 23

Euro/U.S.Dollar(EURUSD) Elliott Wave Technical Analysis 19 December 23

The EURUSD Elliott Wave Analysis for the day chart on 19 December 23, suggests an impulsive wave lab...

Read More >
Outlines the Future market movements with KOSPI Composite Index Elliott Wave Technical Analysis

Outlines the Future market movements with KOSPI Composite Index Elliott Wave Technical Analysis

This article provides an in-depth Elliott Wave analysis of the KOSPI Composite Index, covering both ...

Read More >
Natural Gas Commodity Elliottwave Technical Analysis:  An In-depth Analysis of the Current Impulse Wave

Natural Gas Commodity Elliottwave Technical Analysis: An In-depth Analysis of the Current Impulse Wave

Elliott Wave analysis of Natural Gas, focusing on the ongoing impulse wave sequence that began in A...

Read More >
Silver XAGUSD Commodity Elliott Wave Analysis: Forecasting Price Movements and Trading Opportunities in 2024

Silver XAGUSD Commodity Elliott Wave Analysis: Forecasting Price Movements and Trading Opportunities in 2024

Elliott Wave analysis of Silver, focusing on its market trends starting from early 2024. We discuss ...

Read More >

Buy 1 Month

Get 3 Months!

Special Offer:

Trade Recommendations

Unleash the power of deversified trading with our comprehensive portfolio, covering:

  • Stock Trades
  • Crypto Trades
  • Forex Trades
  • Commodity Trades
Elliott Wave Analysis

Gain a competive edge with expert insights in to:

  • Global Indices
  • US Stocks & ASX Stocks
  • Forex & Crypto
  • Commodities
Top-Notch Trading Tools

Equip yourself with the tools of success:

  • Social Chat
  • Elliott Wave Algorithm
  • Screener
  • TradingLevels
  • Trading Game
7 Elliott Wave Analysts

Stay ahead of the market with daily charts and insightful videos
-Your secret to strategic trading!

JOIN HERE


Welcome to TradingLounge (ASIC A.R.No. 321187), specialists in trades, trading education and technical analysis, covering stocks, indices, commodities, forex and cryptocurrencies.

When you join TradingLounge you have access to everything we offer, including trade tools, educational content and a social platform to chat with like-minded investors.

Read more

@Copyright 2024 by tradinglounge.com

Contact Us

Australian no: 02 4787 6020

International no: +61 (2) 47876020

Pay with:

Find us on