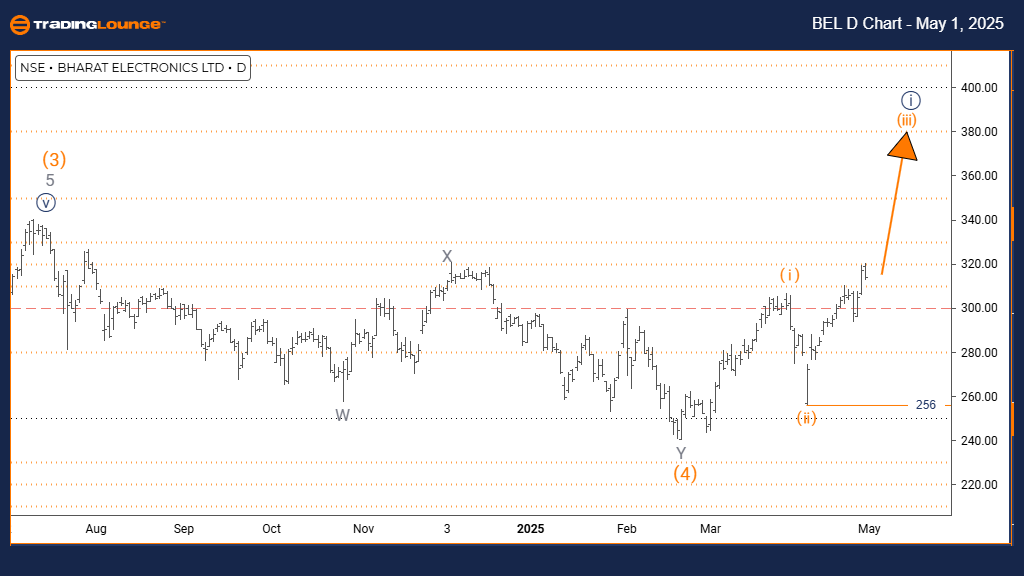
BHARAT ELECTRONICS Elliott Wave Analysis | TradingLounge Daily Chart
Bharat Electronics Stocks Daily Chart Analysis
BHARAT ELECTRONICS Elliott Wave Technical Analysis
Technical Overview
Function: Bullish Trend
Mode: Impulsive
Structure: Orange Wave 3
Position: Navy Blue Wave 1
Direction Next Lower Degrees: Orange Wave 4
Details: Orange Wave 2 appears to be completed. Orange Wave 3 is now underway.
Cancel Invalidation Level: 256
The BHARAT ELECTRONICS Daily Elliott Wave Analysis indicates a strong bullish trend within an impulsive wave structure. The recent completion of Orange Wave 2 has triggered the powerful Orange Wave 3 rally, nested within the broader Navy Blue Wave 1 formation. This pattern suggests BHARAT ELECTRONICS is entering the most dynamic phase of its Elliott Wave cycle, characterized by rapid price advances and strong upward momentum.
Orange Wave 3, typically the strongest in an impulsive sequence, often produces the sharpest gains. Following the corrective pullback of Wave 2, conditions are now favorable for an aggressive upward move that may exceed the gains from Wave 1. Current technical readings confirm bullish strength, signaling a continued rally ahead before any significant correction.
Next Movement Expectations
The critical level to watch is 256. A break below this invalidation point would negate the current bullish Elliott Wave count and call for a reassessment. This level serves as essential support, preserving the bullish structure established by the completion of Orange Wave 2.
The daily chart for BHARAT ELECTRONICS suggests strong upside potential during this impulsive phase. Traders should monitor for classic Wave 3 features—such as accelerating momentum, consistent higher highs, and respect for key support levels. Maintaining bullish trading strategies is recommended until clear signs of Wave 3 maturation emerge.
Supporting technical indicators and increasing volume will act as key confirmations for the wave’s ongoing strength. As the Navy Blue Wave 1 trend unfolds, further bullish momentum is anticipated, offering excellent opportunities for trend-following traders.
Upon the completion of Orange Wave 3, the next expected movement is Orange Wave 4, providing a corrective pullback before the next rally. This sets up prime trading conditions, as Wave 3 traditionally offers the best risk-reward opportunities in Elliott Wave structures.
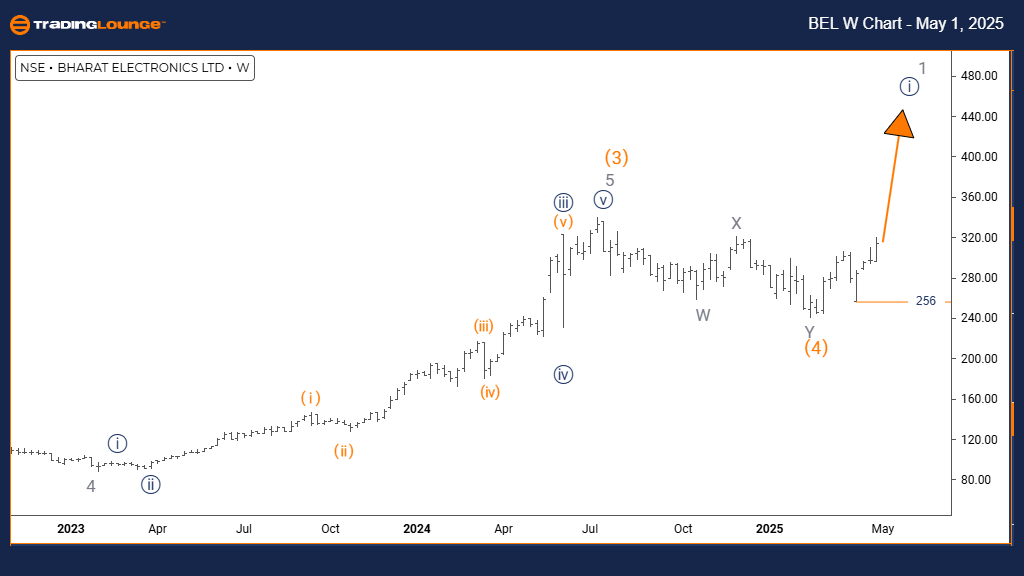
BHARAT ELECTRONICS Elliott Wave Analysis | TradingLounge Weekly Chart
BHARAT ELECTRONICS Elliott Wave Technical Analysis
Technical Overview
Function: Bullish Trend
Mode: Impulsive
Structure: Navy Blue Wave 1
Position: Gray Wave 1
Direction Next Lower Degrees: Navy Blue Wave 2
Details: Orange Wave 4 appears completed. Now, Navy Blue Wave 1 of Gray Wave 1 is active.
Cancel Invalidation Level: 256
The BHARAT ELECTRONICS Weekly Elliott Wave Analysis showcases a developing bullish trend within an impulsive structure. The completion of Orange Wave 4 has initiated Navy Blue Wave 1 inside the broader Gray Wave 1 framework, indicating the early stages of a new upward Elliott Wave cycle.
Navy Blue Wave 1 represents the beginning of a larger bullish trend, often marked by steady yet decisive price movements. With Orange Wave 4’s correction behind, conditions now favor a sustainable rally. Although initial moves in Wave 1 are typically moderate compared to later stages, the weekly chart points toward a strengthening uptrend.
Next Movement Expectations
The 256 level remains a crucial invalidation point. A drop below this support would invalidate the current bullish Elliott Wave count and require a fresh review. Holding above this level maintains the structure’s integrity and supports bullish projections.
This weekly Elliott Wave analysis for BHARAT ELECTRONICS highlights the formation of a potentially strong intermediate-term trend. Transitioning into Gray Wave 1 suggests that momentum may build substantially in subsequent waves, making this an important phase for strategic trade positioning.
Traders should observe classic early-wave characteristics: consistent price appreciation, rising trading volumes, and supportive technical indicators. While Wave 1 movements tend to be gradual, they lay the foundation for stronger impulses ahead, particularly Wave 3.
Once Navy Blue Wave 1 concludes, the next expectation is a corrective pullback in Navy Blue Wave 2, offering another strategic entry opportunity before a potential surge in the next bullish phase. The weekly timeframe emphasizes the importance of recognizing this unfolding bullish Elliott Wave structure for optimizing medium-term trading strategies.
Technical Analyst: Malik Awais
Source: Visit Tradinglounge.com and learn from the Experts. Join TradingLounge Here
Previous: JSW STEEL Elliott Wave Technical Analysis
VALUE Offer - Buy 1 Month & Get 3 Months!Click here
Access 7 Analysts Over 200 Markets Covered. Chat Room With Support