ASX: V300AEQ ETF UNITS – VAS Elliott Wave Technical Analysis (1D Chart)

Greetings, today's Elliott Wave analysis focuses on the Australian Stock Exchange (ASX) with V300AEQ ETF UNITS – VAS. Our analysis suggests that VAS may begin advancing with a 3-grey wave.

ASX: V300AEQ ETF UNITS – VAS Elliott Wave Technical Analysis

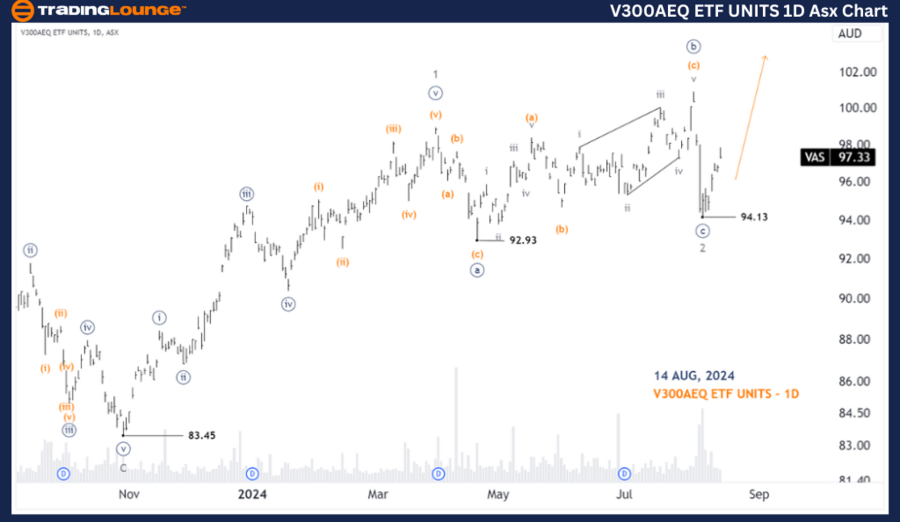
ASX: V300AEQ ETF UNITS – VAS 1D Chart (Semilog Scale) Analysis

Function: Major trend (Minor degree, grey)

Mode: Motive

Structure: Impulse

Position: Wave 3-grey

Details: Wave 2-grey concluded at the 94.13 low in an Expanded Flat. Wave 3-grey could potentially drive the price higher, with an initial target near 110.00.

Invalidation point: 94.13

V300AEQ-ETF-UNITS-1D...


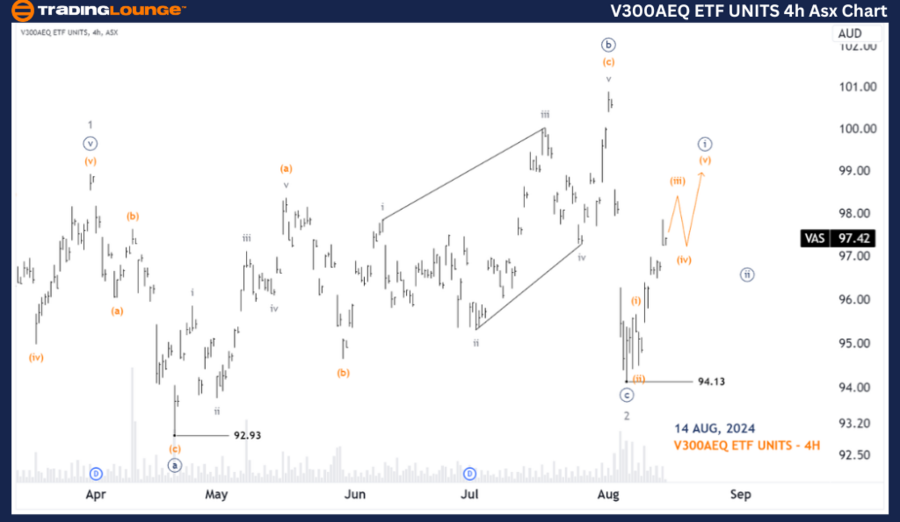
ASX: V300AEQ ETF UNITS – VAS Elliott Wave Technical Analysis (4-Hour Chart)

ASX: V300AEQ ETF UNITS – VAS Stock Technical Analysis

ASX: V300AEQ ETF UNITS – VAS 4-Hour Chart Analysis

Function: Counter trend (Minute degree, navy)

Mode: Corrective

Structure: Flat

Position: Wave (iii)-orange of Wave ((i))-navy

Details: Since the 94.13 low, the 3-grey wave is forming, further breaking down into the ((i))-navy wave. The ((i))-navy wave itself is subdividing into five waves. The trend is expected to continue upward until it fulfills its structure. Afterward, the ((ii))-navy wave may initiate a slight decline. A Long Trade Setup will be considered once the ((ii))-navy wave completes, targeting the ((iii))-navy wave that follows.

Invalidation point: 94.13

Conclusion

Our analysis and short-term forecast for ASX: V300AEQ ETF UNITS – VAS aim to provide insights into the current market trends, helping traders capitalize on them effectively. We highlight specific price points that serve as validation or invalidation signals for our wave count, enhancing the reliability of our outlook. By integrating these factors, we offer a professional and objective perspective on market trends.

Technical Analyst: Hua (Shane) Cuong, CEWA-M (Master’s Designation).

Source: visit Tradinglounge.com and learn From the Experts Join TradingLounge Here 

Previous:  REA GROUP LTD – REA Elliott Wave Technical Analysis 

Special Trial Offer - 0.76 Cents a Day for 3 Months! Click here

Access 7 Analysts Over 170 Markets Covered. Chat Room With Support

V300AEQ-ETF-UNITS-4h...

Related

Eicher Motors Elliott Wave Analysis Reveals Bullish Trend, Wave Count Insights, Stock Forecast, and Technical Chart Breakdown

Eicher Motors Elliott Wave Analysis Reveals Bullish Trend, Wave Count Insights, Stock Forecast, and Technical Chart Breakdown

Elliott Wave analysis of Eicher Motors, covering its current position in navy blue wave 5 and the po...

Read More >
Market's Future Movements in Commodities prices - Coffee Elliott Wave Technical analysis

Market's Future Movements in Commodities prices - Coffee Elliott Wave Technical analysis

This article presents a detailed Elliott Wave Analysis of coffee commodity prices, exploring counter...

Read More >
Polkadot (DOTUSD) Elliott Wave Analysis & Trading Strategy - February 5, 24

Polkadot (DOTUSD) Elliott Wave Analysis & Trading Strategy - February 5, 24

Delve into Polkadot's (DOTUSD) market dynamics with expert Elliott Wave analysis and strategic i...

Read More >
Ethereum ETH (ETH-USD) Price Chart Analysis daily | ETHUSD Elliott Wave Technical Analysis daily

Ethereum ETH (ETH-USD) Price Chart Analysis daily | ETHUSD Elliott Wave Technical Analysis daily

Elliott Wave Analysis TradingLounge Daily Chart, 11 October 23 Ethereum/U.S. dollar(ETHUSD) ETHUSD...

Read More >
Swiss Market Index Elliott Wave Technical Analysis: Covering key Trading Strategies, Investment Insights, and Market Updates

Swiss Market Index Elliott Wave Technical Analysis: Covering key Trading Strategies, Investment Insights, and Market Updates

This comprehensive guide provides an in-depth Elliott Wave analysis of the Swiss Market Index (SMI ...

Read More >
Bajaj Finserv Elliott Wave Technical Analysis for Daily and Weekly Charts | Stock Forecast, and Trading Strategy Insights

Bajaj Finserv Elliott Wave Technical Analysis for Daily and Weekly Charts | Stock Forecast, and Trading Strategy Insights

Elliott Wave analysis of Bajaj Finserv, highlighting daily and weekly chart patterns. It covers the ...

Read More >

Buy 1 Month

Get 3 Months!

Special Offer:

Trade Recommendations

Unleash the power of deversified trading with our comprehensive portfolio, covering:

  • Stock Trades
  • Crypto Trades
  • Forex Trades
  • Commodity Trades
Elliott Wave Analysis

Gain a competive edge with expert insights in to:

  • Global Indices
  • US Stocks & ASX Stocks
  • Forex & Crypto
  • Commodities
Top-Notch Trading Tools

Equip yourself with the tools of success:

  • Social Chat
  • Elliott Wave Algorithm
  • Screener
  • TradingLevels
  • Trading Game
7 Elliott Wave Analysts

Stay ahead of the market with daily charts and insightful videos
-Your secret to strategic trading!

JOIN HERE


Welcome to TradingLounge (ASIC A.R.No. 321187), specialists in trades, trading education and technical analysis, covering stocks, indices, commodities, forex and cryptocurrencies.

When you join TradingLounge you have access to everything we offer, including trade tools, educational content and a social platform to chat with like-minded investors.

Read more

@Copyright 2024 by tradinglounge.com

Contact Us

Australian no: 02 4787 6020

International no: +61 (2) 47876020

Pay with:

Find us on