23May

ASX: INSURANCE AUSTRALIA GROUP LIMITED – IAG Elliott Wave Analysis Reveals Bearish Trend With Short-Term Targets And Key Price Levels For Traders

ASX: IAG Elliott Wave Technical Analysis – Insurance Australia Group Limited – TradingLounge

Today’s updated Elliott Wave technical analysis focuses on Insurance Australia Group Limited (ASX:IAG), a major ASX-listed financial services stock. Current chart patterns indicate that ASX:IAG is finalizing a corrective B-grey wave, with signs pointing toward a potential decline in a new downward C-grey wave. The lack of upward momentum suggests that initiating a long position at this point carries elevated risk.


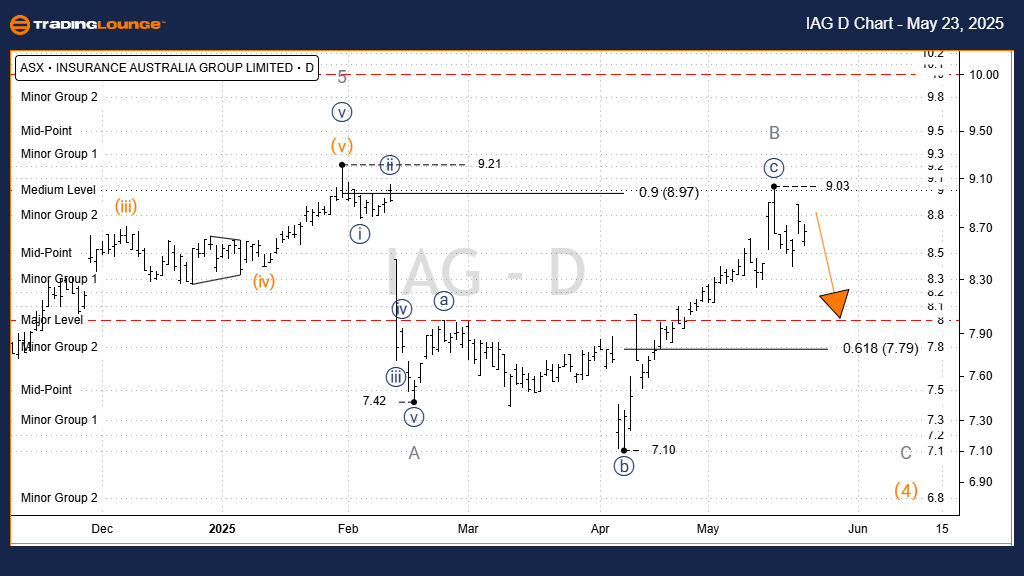
ASX: IAG – Elliott Wave Technical Analysis Chart Type: 1-Day (Semilog Scale)

Function: Major trend (Minor degree, grey)

Mode: Motive

Structure: Impulse

Position: Wave C-grey

Key Analysis Insights:

  • Wave 3-orange ended with a classic five-wave structure.
  • Wave 4-orange is taking shape as a downward Zigzag correction (A, B, C-grey).
  • Wave A-grey is confirmed complete.
  • Wave B-grey has likely ended as an Expanded Flat pattern.
  • The market appears to be starting Wave C-grey with a downward trajectory, with an initial support target near 7.79.

Invalidation Level: 9.03 – Any move above this would invalidate the current bearish outlook.

IAG-ASX-Stock-Day-ch...


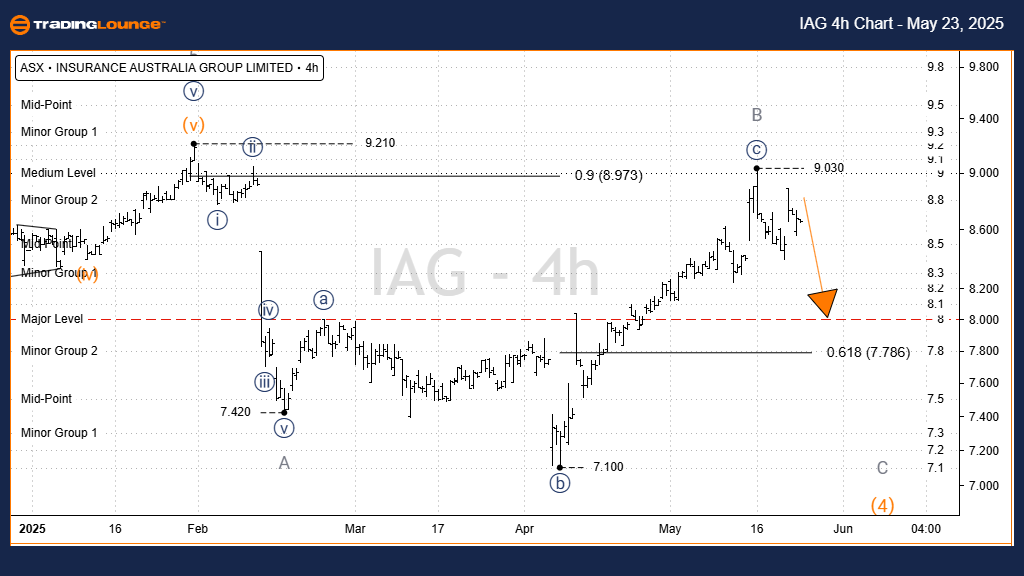
ASX:IAG – Elliott Wave Technical Analysis – TradingLounge (4-Hour Chart)

ASX:IAG – Short-Term Elliott Wave Analysis (4H Chart)

Function: Major trend (Minor degree, grey)

Mode: Motive

Structure: Impulse

Position: Wave C-grey

Detailed Wave Breakdown:

  • Both A-grey and B-grey waves have completed.
  • Since topping at 9.03, Wave C-grey appears to be unfolding downward.
  • The immediate price target stands at 7.79.
  • Deeper price projections suggest possible support zones between 7.42 and 7.10.

Critical Invalidation Point: 9.03 – Price must remain under this level for the bearish count to remain valid.

Technical Analyst: Hua (Shane) Cuong, CEWA-M (Master’s Designation).

Source: Visit Tradinglounge.com and learn from the Experts. Join TradingLounge Here 

See Previous: SQ2 Elliott Wave Technical Analysis

VALUE Offer - Buy 1 Month & Get 3 Months!Click here

Access 7 Analysts Over 200 Markets Covered. Chat Room With Support

IAG-ASX-Stock-4H-cha...


Conclusion:
This Elliott Wave analysis on ASX:IAG provides a precise technical snapshot, highlighting essential support and resistance levels for traders. These key insights offer actionable guidance for risk management and strategic planning, supporting data-driven trading decisions in the current market context.

Related

AAVEUSD Elliott Wave Analysis: Price Prediction, Trading Strategy, Support & Resistance Levels, and Market Trends for 2025

AAVEUSD Elliott Wave Analysis: Price Prediction, Trading Strategy, Support & Resistance Levels, and Market Trends for 2025

AAVE/USD Elliott Wave analysis, highlighting Wave V and its potential impact on AAVE price predictio...

Read More >
GX Uranium ETF (URA) Commodity Elliott Wave Technical Analysis: Navigating Market Corrections

GX Uranium ETF (URA) Commodity Elliott Wave Technical Analysis: Navigating Market Corrections

This detailed analysis of the GX Uranium ETF (URA) using Elliott Wave theory provides an in-depth lo...

Read More >
Gold Elliott Wave Analysis: Bullish Trend Towards $3,000 with Possible Pullbacks Creating new Buying Opportunities

Gold Elliott Wave Analysis: Bullish Trend Towards $3,000 with Possible Pullbacks Creating new Buying Opportunities

Gold is in a strong bullish trend, with Elliott Wave analysis indicating further upside potential. T...

Read More >
Comprehensive Elliott Wave Analysis: S&P 500, NASDAQ, and Key Indices

Comprehensive Elliott Wave Analysis: S&P 500, NASDAQ, and Key Indices

This comprehensive analysis covers key stock market indices, including the S&P 500, NASDAQ 100, and ...

Read More >
Adani Enterprises Elliott Wave Analysis: Technical Insights, Price Predictions, and Chart Analysis for Informed Trading Decisions

Adani Enterprises Elliott Wave Analysis: Technical Insights, Price Predictions, and Chart Analysis for Informed Trading Decisions

A comprehensive Elliott Wave analysis of Adani Enterprises discovers insights into the stock's c...

Read More >
NASDAQ 100 STOCKS, AAPL, AMZN, NVDA, META, NFLX, GOOGL, MSFT, TSLA. Elliott Wave Technical Analysis

NASDAQ 100 STOCKS, AAPL, AMZN, NVDA, META, NFLX, GOOGL, MSFT, TSLA. Elliott Wave Technical Analysis

This update on Elliott Wave Analysis highlights the current upward trend in indices and most stocks,...

Read More >

$1 for 2 Weeks

then $29 a month!

What a Special Offer!

Trade Recommendations

Unleash the power of deversified trading with our comprehensive portfolio, covering 250+ markets:

  • Stock Trades
  • Crypto Trades
  • Forex Trades
  • Commodity Trades
Elliott Wave Analysis

Gain a competitive edge with expert insights and AI-powered Elliott Wave charting into:

  • Global Indices
  • US Stocks & ASX Stocks
  • Forex & Crypto
  • Commodities
Top-Notch Trading Tools

Equip yourself with the tools of success:

  • Real-time Chat rooms
  • Elliott Wave Algorithm
  • Portfolio tools
  • TradingLevels
  • Screener
  • Trading Game
7 Elliott Wave Analysts

Stay ahead of the market with daily charts and insightful videos
Your secret to strategic trading!

JOIN HERE


Welcome to TradingLounge (ASIC A.R.No. 321187), specialists in trades, trading education and technical analysis, covering stocks, indices, commodities, forex and cryptocurrencies.

When you join TradingLounge you have access to everything we offer, including trade tools, educational content and a social platform to chat with like-minded investors.

Read more

@Copyright 2024 by tradinglounge.com

Contact Us

Australian no: 02 4787 6020

International no: +61 (2) 47876020

Pay with:

Find us on