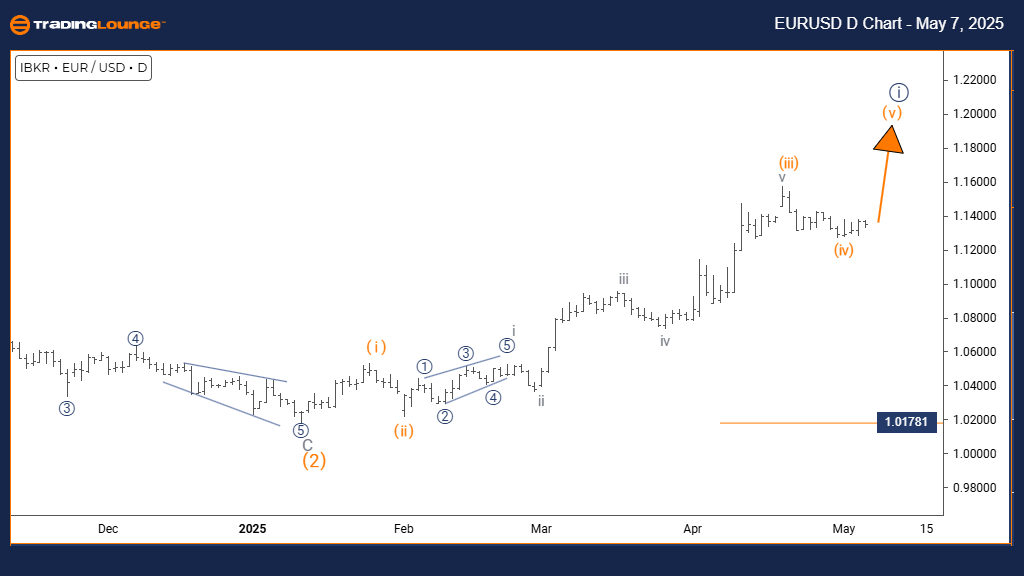
Euro/ U.S. Dollar (EURUSD) Daily Chart
EURUSD Elliott Wave Technical Analysis
FUNCTION: Bullish Trend
MODE: Impulsive
STRUCTURE: Orange Wave 5
POSITION: Navy Blue Wave 1
DIRECTION NEXT LOWER DEGREES: Navy Blue Wave 2
DETAILS: Orange Wave 4 appears completed; Orange Wave 5 is currently active.
Wave Cancel/Invalid Level: 1.01781
The EURUSD daily chart highlights a strong bullish trend progressing through an impulsive Elliott Wave structure. The pair has successfully completed Orange Wave 4 and is now advancing into Orange Wave 5, forming part of the broader Navy Blue Wave 1 setup. This movement indicates one final bullish leg before a potential major correction.
Orange Wave 5 represents the last phase of the ongoing bullish momentum. It may show continued strength or signs of exhaustion as it develops. The completion of Orange Wave 4 set the stage for this rally, potentially targeting or surpassing previous highs. The present Elliott Wave analysis suggests the final push within this impulsive structure is underway.
The daily timeframe offers essential insights into the overall trend, emphasizing the closing stages of the current uptrend. Progression into Navy Blue Wave 1 on a higher degree points to a significant structure still evolving. Traders should closely monitor the critical invalidation level at 1.01781; a move below this point would necessitate a fresh EURUSD Elliott Wave count.
Monitoring Wave 5 for ending signals, such as bearish divergence on momentum indicators or emerging reversal patterns, is crucial. The EURUSD Elliott Wave forecast suggests that a trend reversal could be near, although potential Wave 5 extensions might prolong the bullish rally.
Technical indicators and careful observation of price action will be key in identifying when the bullish strength wanes and the corrective phase begins. Upon completing Wave 5, a move into Navy Blue Wave 2 is expected, likely offering a meaningful pullback opportunity before any broader uptrend resumes.
Staying attentive to price dynamics is vital for confirming the end of Wave 5 and anticipating the onset of the next corrective structure. This daily analysis stresses the importance of the current transition phase for medium-term trading strategies.
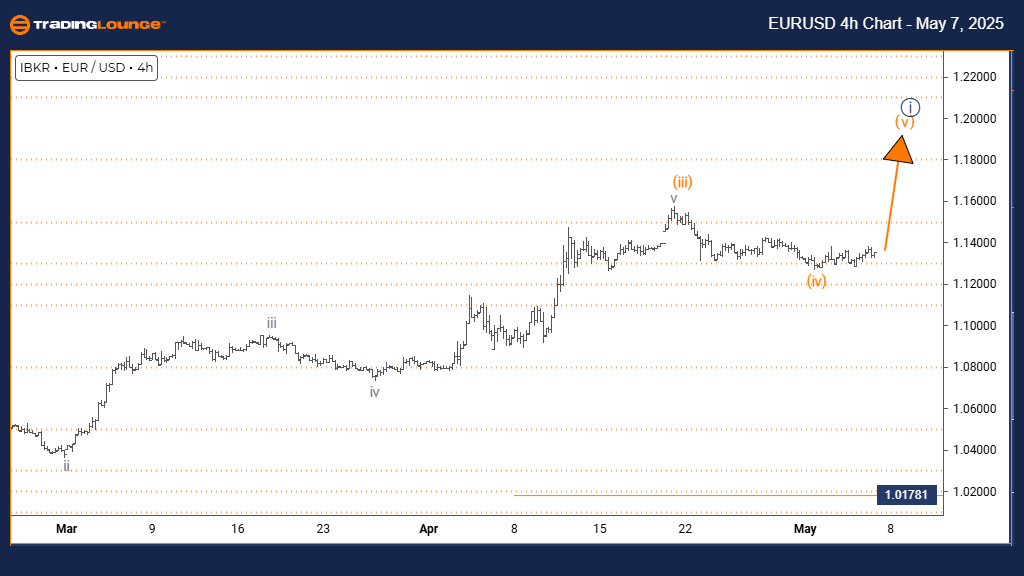
Euro/ U.S. Dollar (EURUSD) 4-Hour Chart
EURUSD Elliott Wave Technical Analysis
FUNCTION: Bullish Trend
MODE: Impulsive
STRUCTURE: Orange Wave 5
POSITION: Navy Blue Wave 1
DIRECTION NEXT HIGHER DEGREES: Orange Wave 5 (started)
DETAILS: Orange Wave 4 appears completed; Orange Wave 5 is advancing.
Wave Cancel/Invalid Level: 1.01781
The EURUSD 4-hour chart shows a bullish trend continuation through an impulsive Elliott Wave pattern. Following the completion of Orange Wave 4, the market has transitioned into Orange Wave 5, a part of the wider Navy Blue Wave 1. This development hints at one final bullish push before an anticipated corrective wave.
Orange Wave 5 signals the concluding phase of the current bullish run. It might either show sustained strength or start weakening as it nears the end. The completion of Orange Wave 4 enabled this move, aiming to test or break past previous highs. According to the current EURUSD Elliott Wave structure, the upward move could be approaching its final stages.
After finishing Orange Wave 5, Navy Blue Wave 2 is expected to begin. This corrective phase may offer a pullback opportunity following the end of the rally. It is crucial to watch the invalidation level at 1.01781. A break below this point would call for a new wave interpretation.
Traders should observe traditional end-of-wave signals, like bearish divergence on momentum indicators or reversal formations, to anticipate the trend change. The 4-hour chart gives a precise view of the current bullish trend's maturity. However, Wave 5 extensions can push the rally further than initially expected.
Using technical indicators and observing price behavior are essential to determine when the bullish momentum fades and corrective movement starts. This analysis encourages vigilance toward potential trend completion signals while closely monitoring the invalidation level. A transition into Navy Blue Wave 2 would imply a temporary pause in the broader bullish trend before it continues.
Technical Analyst: Malik Awais
Source: Visit Tradinglounge.com and learn from the Experts. Join TradingLounge Here
Previous: USDCHF Elliott Wave Technical Analysis
VALUE Offer - Buy 1 Month & Get 3 Months!Click here
Access 7 Analysts Over 200 Markets Covered. Chat Room With Support